Alsatian vs Pima GED/Equivalency
COMPARE
Alsatian
Pima
GED/Equivalency
GED/Equivalency Comparison
Alsatians
Pima
86.0%
GED/EQUIVALENCY
64.3/ 100
METRIC RATING
165th/ 347
METRIC RANK
76.4%
GED/EQUIVALENCY
0.0/ 100
METRIC RATING
342nd/ 347
METRIC RANK
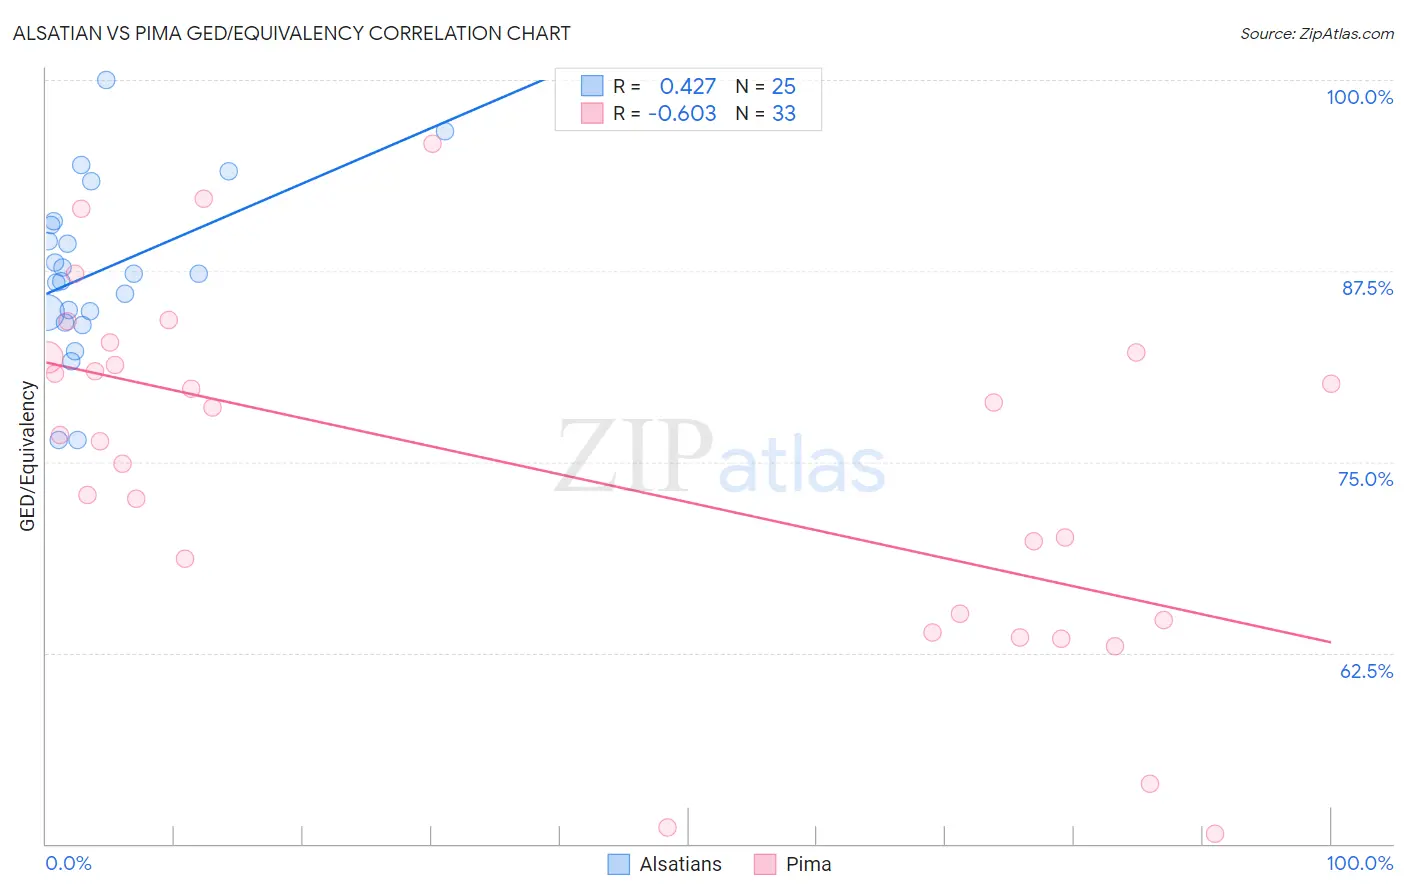
Alsatian vs Pima GED/Equivalency Correlation Chart
The statistical analysis conducted on geographies consisting of 82,682,365 people shows a moderate positive correlation between the proportion of Alsatians and percentage of population with at least ged/equivalency education in the United States with a correlation coefficient (R) of 0.427 and weighted average of 86.0%. Similarly, the statistical analysis conducted on geographies consisting of 61,552,828 people shows a significant negative correlation between the proportion of Pima and percentage of population with at least ged/equivalency education in the United States with a correlation coefficient (R) of -0.603 and weighted average of 76.4%, a difference of 12.5%.
GED/Equivalency Correlation Summary
| Measurement | Alsatian | Pima |
| Minimum | 76.4% | 50.7% |
| Maximum | 100.0% | 95.8% |
| Range | 23.6% | 45.2% |
| Mean | 87.5% | 74.7% |
| Median | 87.3% | 76.8% |
| Interquartile 25% (IQ1) | 84.5% | 64.8% |
| Interquartile 75% (IQ3) | 90.6% | 82.0% |
| Interquartile Range (IQR) | 6.2% | 17.2% |
| Standard Deviation (Sample) | 5.6% | 11.4% |
| Standard Deviation (Population) | 5.5% | 11.2% |
Similar Demographics by GED/Equivalency
Demographics Similar to Alsatians by GED/Equivalency
In terms of ged/equivalency, the demographic groups most similar to Alsatians are Immigrants from Albania (86.0%, a difference of 0.0%), Ethiopian (86.0%, a difference of 0.010%), Venezuelan (86.0%, a difference of 0.030%), Ugandan (86.1%, a difference of 0.040%), and Sierra Leonean (86.0%, a difference of 0.050%).
| Demographics | Rating | Rank | GED/Equivalency |
| German Russians | 72.1 /100 | #158 | Good 86.2% |
| Immigrants | Kenya | 71.8 /100 | #159 | Good 86.2% |
| Immigrants | Morocco | 69.5 /100 | #160 | Good 86.1% |
| Immigrants | Syria | 69.3 /100 | #161 | Good 86.1% |
| Immigrants | Iraq | 68.1 /100 | #162 | Good 86.1% |
| Ugandans | 66.3 /100 | #163 | Good 86.1% |
| Venezuelans | 65.5 /100 | #164 | Good 86.0% |
| Alsatians | 64.3 /100 | #165 | Good 86.0% |
| Immigrants | Albania | 64.2 /100 | #166 | Good 86.0% |
| Ethiopians | 63.7 /100 | #167 | Good 86.0% |
| Sierra Leoneans | 61.8 /100 | #168 | Good 86.0% |
| Immigrants | Ethiopia | 61.2 /100 | #169 | Good 86.0% |
| Afghans | 59.7 /100 | #170 | Average 85.9% |
| Immigrants | Chile | 57.3 /100 | #171 | Average 85.9% |
| Bermudans | 55.1 /100 | #172 | Average 85.8% |
Demographics Similar to Pima by GED/Equivalency
In terms of ged/equivalency, the demographic groups most similar to Pima are Immigrants from Central America (76.4%, a difference of 0.090%), Spanish American Indian (76.3%, a difference of 0.12%), Immigrants from Mexico (75.7%, a difference of 1.0%), Mexican (77.4%, a difference of 1.3%), and Tohono O'odham (77.5%, a difference of 1.4%).
| Demographics | Rating | Rank | GED/Equivalency |
| Salvadorans | 0.0 /100 | #333 | Tragic 78.6% |
| Guatemalans | 0.0 /100 | #334 | Tragic 78.5% |
| Immigrants | Latin America | 0.0 /100 | #335 | Tragic 78.5% |
| Immigrants | Dominican Republic | 0.0 /100 | #336 | Tragic 78.0% |
| Immigrants | Yemen | 0.0 /100 | #337 | Tragic 77.9% |
| Immigrants | Guatemala | 0.0 /100 | #338 | Tragic 77.9% |
| Immigrants | El Salvador | 0.0 /100 | #339 | Tragic 77.6% |
| Tohono O'odham | 0.0 /100 | #340 | Tragic 77.5% |
| Mexicans | 0.0 /100 | #341 | Tragic 77.4% |
| Pima | 0.0 /100 | #342 | Tragic 76.4% |
| Immigrants | Central America | 0.0 /100 | #343 | Tragic 76.4% |
| Spanish American Indians | 0.0 /100 | #344 | Tragic 76.3% |
| Immigrants | Mexico | 0.0 /100 | #345 | Tragic 75.7% |
| Houma | 0.0 /100 | #346 | Tragic 75.0% |
| Yakama | 0.0 /100 | #347 | Tragic 74.5% |