Zip Codes with the Highest Percentage of Population Employed in Arts, Entertainment & Recreation in Hesperia, CA
RELATED REPORTS & OPTIONS
Arts, Entertainment & Recreation
Hesperia
Compare Zip Codes
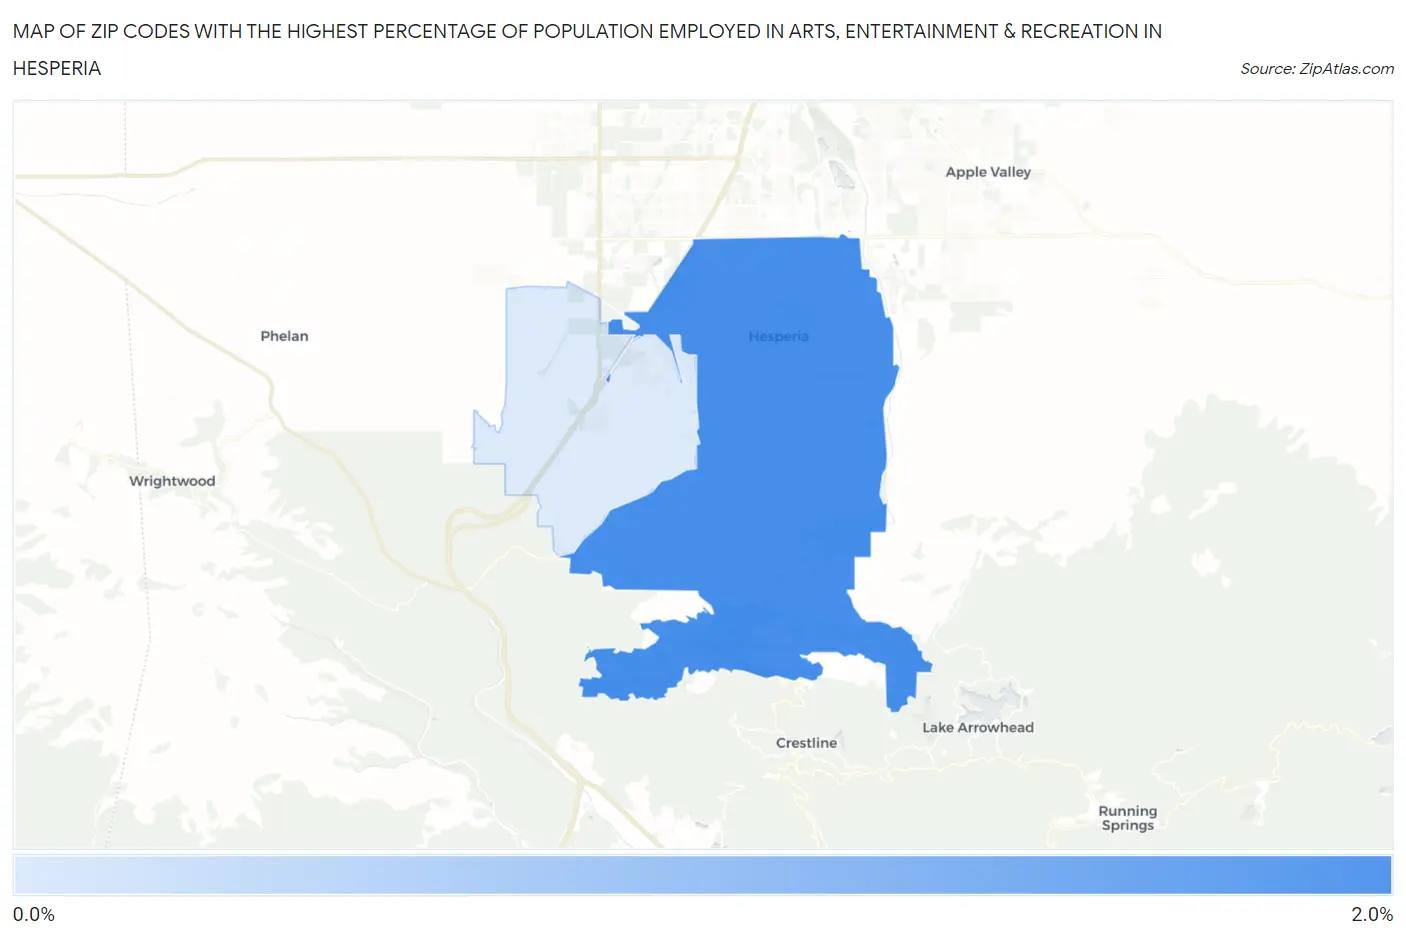
Map of Zip Codes with the Highest Percentage of Population Employed in Arts, Entertainment & Recreation in Hesperia
0.25%
1.6%
Zip Codes with the Highest Percentage of Population Employed in Arts, Entertainment & Recreation in Hesperia, CA
| Zip Code | % Employed | vs State | vs National | |
| 1. | 92345 | 1.6% | 2.6%(-0.975)#1,087 | 2.1%(-0.504)#12,619 |
| 2. | 92344 | 0.25% | 2.6%(-2.30)#1,420 | 2.1%(-1.83)#21,951 |
1
Common Questions
What are the Top Zip Codes with the Highest Percentage of Population Employed in Arts, Entertainment & Recreation in Hesperia, CA?
Top Zip Codes with the Highest Percentage of Population Employed in Arts, Entertainment & Recreation in Hesperia, CA are:
What zip code has the Highest Percentage of Population Employed in Arts, Entertainment & Recreation in Hesperia, CA?
92345 has the Highest Percentage of Population Employed in Arts, Entertainment & Recreation in Hesperia, CA with 1.6%.
What is the Percentage of Population Employed in Arts, Entertainment & Recreation in Hesperia, CA?
Percentage of Population Employed in Arts, Entertainment & Recreation in Hesperia is 1.4%.
What is the Percentage of Population Employed in Arts, Entertainment & Recreation in California?
Percentage of Population Employed in Arts, Entertainment & Recreation in California is 2.6%.
What is the Percentage of Population Employed in Arts, Entertainment & Recreation in the United States?
Percentage of Population Employed in Arts, Entertainment & Recreation in the United States is 2.1%.