Zip Codes with the Highest Percentage of Population Employed in Arts, Entertainment & Recreation in Rancho Cordova, CA
RELATED REPORTS & OPTIONS
Arts, Entertainment & Recreation
Rancho Cordova
Compare Zip Codes
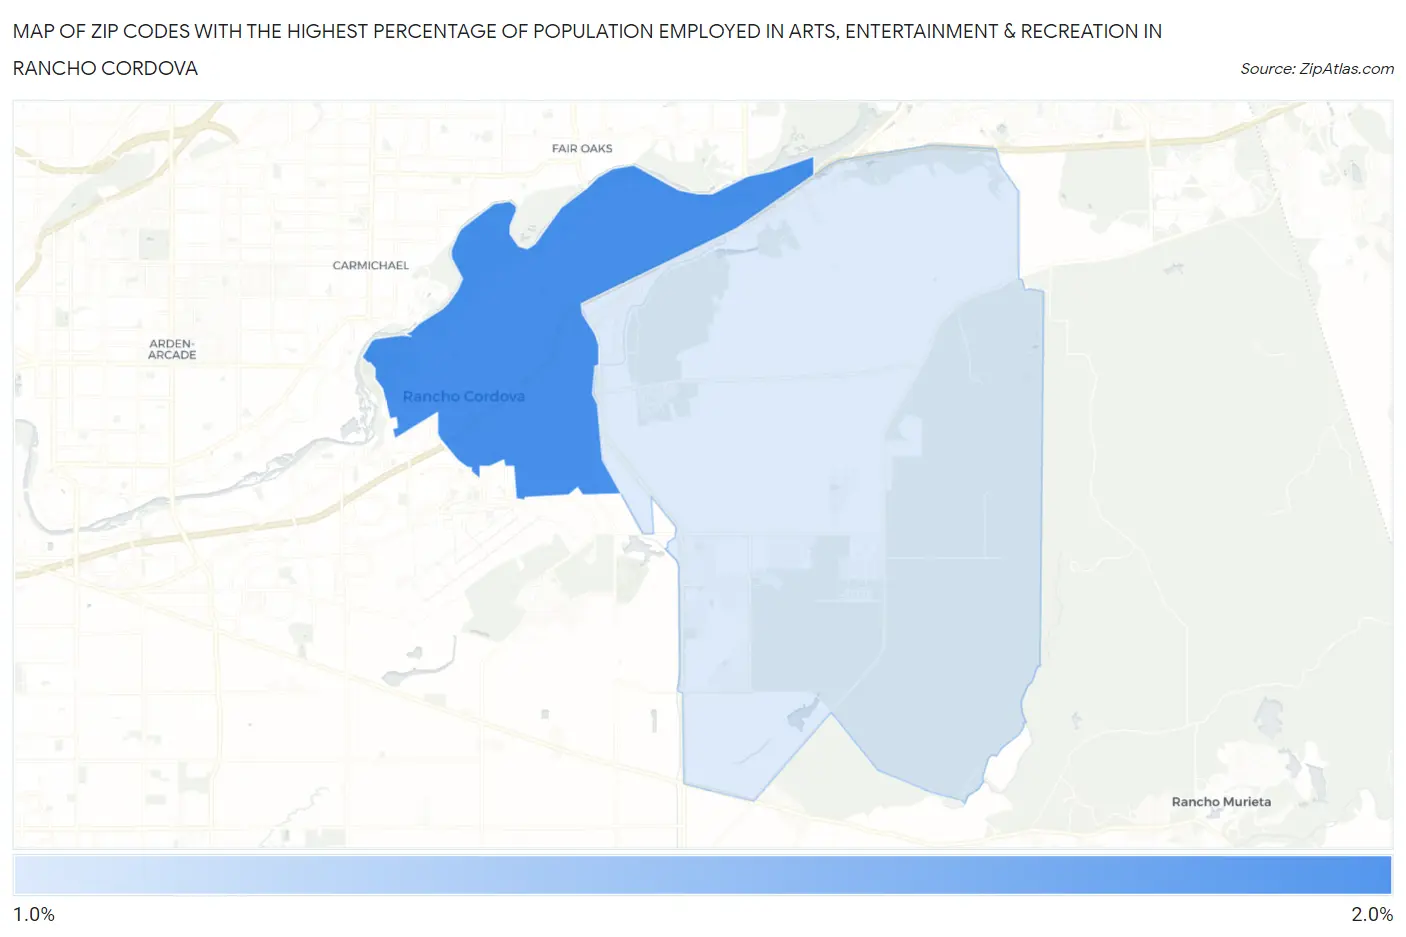
Map of Zip Codes with the Highest Percentage of Population Employed in Arts, Entertainment & Recreation in Rancho Cordova
1.5%
2.0%
Zip Codes with the Highest Percentage of Population Employed in Arts, Entertainment & Recreation in Rancho Cordova, CA
| Zip Code | % Employed | vs State | vs National | |
| 1. | 95670 | 2.0% | 2.6%(-0.570)#926 | 2.1%(-0.099)#9,872 |
| 2. | 95742 | 1.5% | 2.6%(-1.06)#1,136 | 2.1%(-0.592)#13,296 |
1
Common Questions
What are the Top Zip Codes with the Highest Percentage of Population Employed in Arts, Entertainment & Recreation in Rancho Cordova, CA?
Top Zip Codes with the Highest Percentage of Population Employed in Arts, Entertainment & Recreation in Rancho Cordova, CA are:
What zip code has the Highest Percentage of Population Employed in Arts, Entertainment & Recreation in Rancho Cordova, CA?
95670 has the Highest Percentage of Population Employed in Arts, Entertainment & Recreation in Rancho Cordova, CA with 2.0%.
What is the Percentage of Population Employed in Arts, Entertainment & Recreation in Rancho Cordova, CA?
Percentage of Population Employed in Arts, Entertainment & Recreation in Rancho Cordova is 1.7%.
What is the Percentage of Population Employed in Arts, Entertainment & Recreation in California?
Percentage of Population Employed in Arts, Entertainment & Recreation in California is 2.6%.
What is the Percentage of Population Employed in Arts, Entertainment & Recreation in the United States?
Percentage of Population Employed in Arts, Entertainment & Recreation in the United States is 2.1%.