Zip Codes with the Highest Percentage of Population Employed in Arts, Entertainment & Recreation in Santa Clarita, CA
RELATED REPORTS & OPTIONS
Arts, Entertainment & Recreation
Santa Clarita
Compare Zip Codes
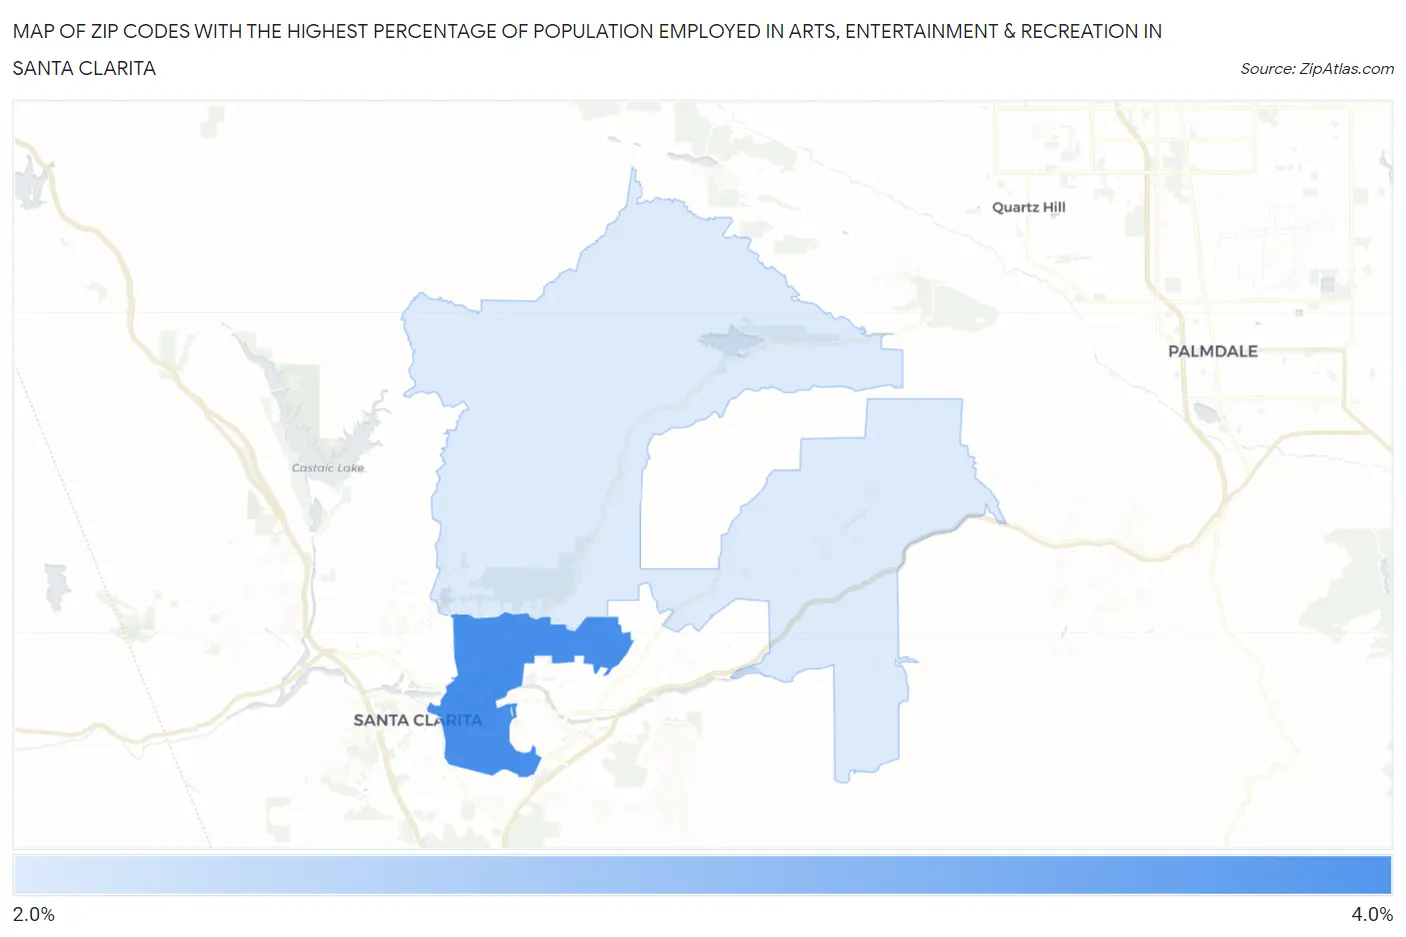
Map of Zip Codes with the Highest Percentage of Population Employed in Arts, Entertainment & Recreation in Santa Clarita
2.6%
3.8%
Zip Codes with the Highest Percentage of Population Employed in Arts, Entertainment & Recreation in Santa Clarita, CA
| Zip Code | % Employed | vs State | vs National | |
| 1. | 91350 | 3.8% | 2.6%(+1.21)#365 | 2.1%(+1.68)#3,680 |
| 2. | 91390 | 2.6% | 2.6%(+0.019)#647 | 2.1%(+0.490)#6,862 |
1
Common Questions
What are the Top Zip Codes with the Highest Percentage of Population Employed in Arts, Entertainment & Recreation in Santa Clarita, CA?
Top Zip Codes with the Highest Percentage of Population Employed in Arts, Entertainment & Recreation in Santa Clarita, CA are:
What zip code has the Highest Percentage of Population Employed in Arts, Entertainment & Recreation in Santa Clarita, CA?
91350 has the Highest Percentage of Population Employed in Arts, Entertainment & Recreation in Santa Clarita, CA with 3.8%.
What is the Percentage of Population Employed in Arts, Entertainment & Recreation in Santa Clarita, CA?
Percentage of Population Employed in Arts, Entertainment & Recreation in Santa Clarita is 3.3%.
What is the Percentage of Population Employed in Arts, Entertainment & Recreation in California?
Percentage of Population Employed in Arts, Entertainment & Recreation in California is 2.6%.
What is the Percentage of Population Employed in Arts, Entertainment & Recreation in the United States?
Percentage of Population Employed in Arts, Entertainment & Recreation in the United States is 2.1%.