Zip Codes with the Highest Percentage of Population Employed in Arts, Entertainment & Recreation in Carson, CA
RELATED REPORTS & OPTIONS
Arts, Entertainment & Recreation
Carson
Compare Zip Codes
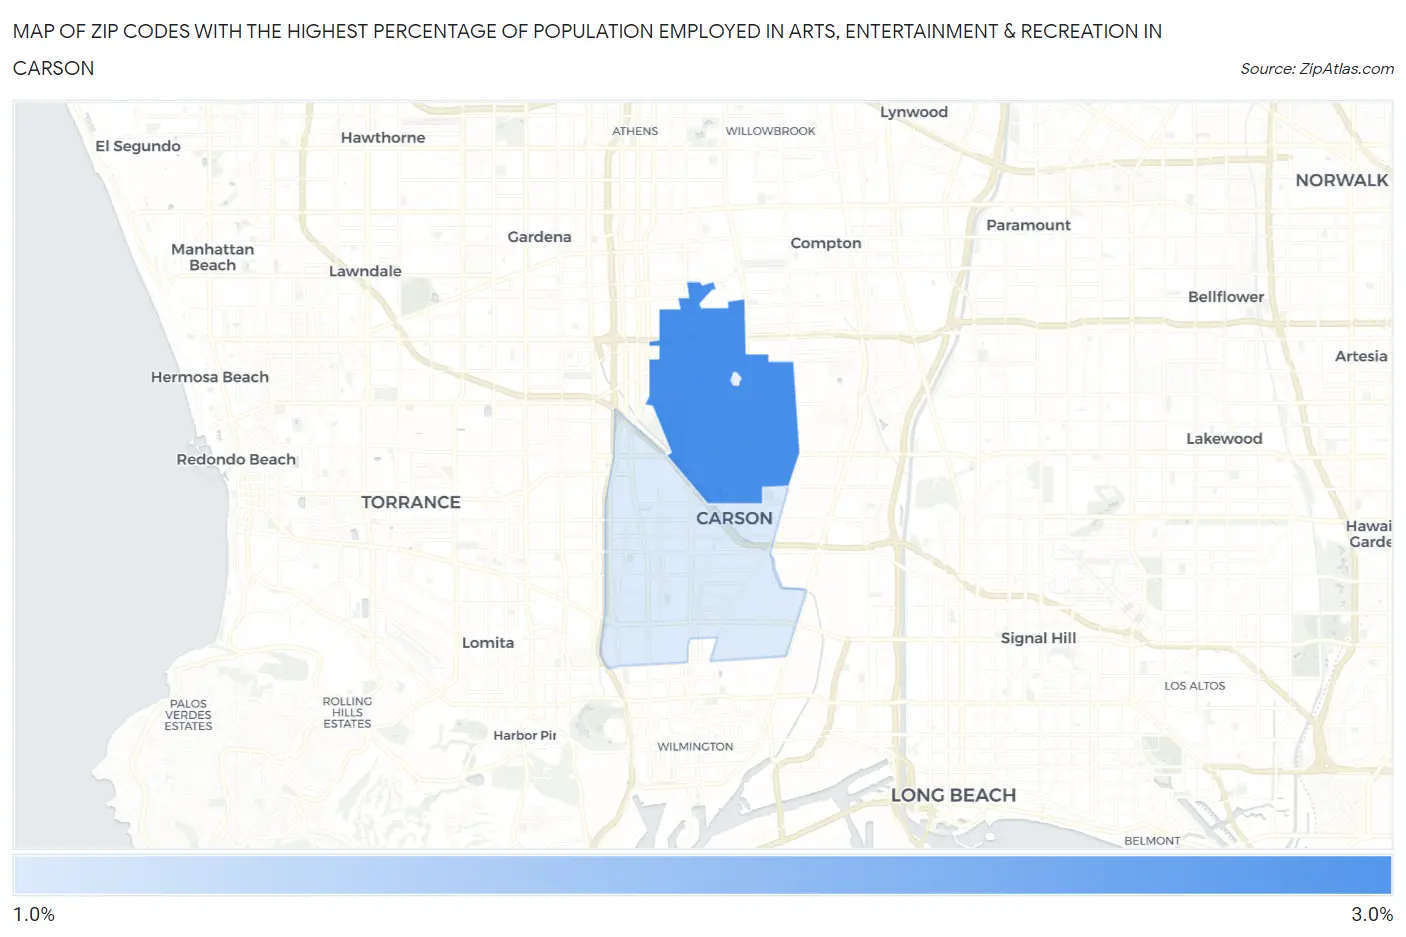
Map of Zip Codes with the Highest Percentage of Population Employed in Arts, Entertainment & Recreation in Carson
1.9%
2.7%
Zip Codes with the Highest Percentage of Population Employed in Arts, Entertainment & Recreation in Carson, CA
| Zip Code | % Employed | vs State | vs National | |
| 1. | 90746 | 2.7% | 2.6%(+0.142)#606 | 2.1%(+0.613)#6,379 |
| 2. | 90745 | 1.9% | 2.6%(-0.637)#949 | 2.1%(-0.165)#10,283 |
1
Common Questions
What are the Top Zip Codes with the Highest Percentage of Population Employed in Arts, Entertainment & Recreation in Carson, CA?
Top Zip Codes with the Highest Percentage of Population Employed in Arts, Entertainment & Recreation in Carson, CA are:
What zip code has the Highest Percentage of Population Employed in Arts, Entertainment & Recreation in Carson, CA?
90746 has the Highest Percentage of Population Employed in Arts, Entertainment & Recreation in Carson, CA with 2.7%.
What is the Percentage of Population Employed in Arts, Entertainment & Recreation in Carson, CA?
Percentage of Population Employed in Arts, Entertainment & Recreation in Carson is 2.1%.
What is the Percentage of Population Employed in Arts, Entertainment & Recreation in California?
Percentage of Population Employed in Arts, Entertainment & Recreation in California is 2.6%.
What is the Percentage of Population Employed in Arts, Entertainment & Recreation in the United States?
Percentage of Population Employed in Arts, Entertainment & Recreation in the United States is 2.1%.