Zip Codes with the Highest Percentage of Population Employed in Arts, Entertainment & Recreation in Yuba City, CA
RELATED REPORTS & OPTIONS
Arts, Entertainment & Recreation
Yuba City
Compare Zip Codes
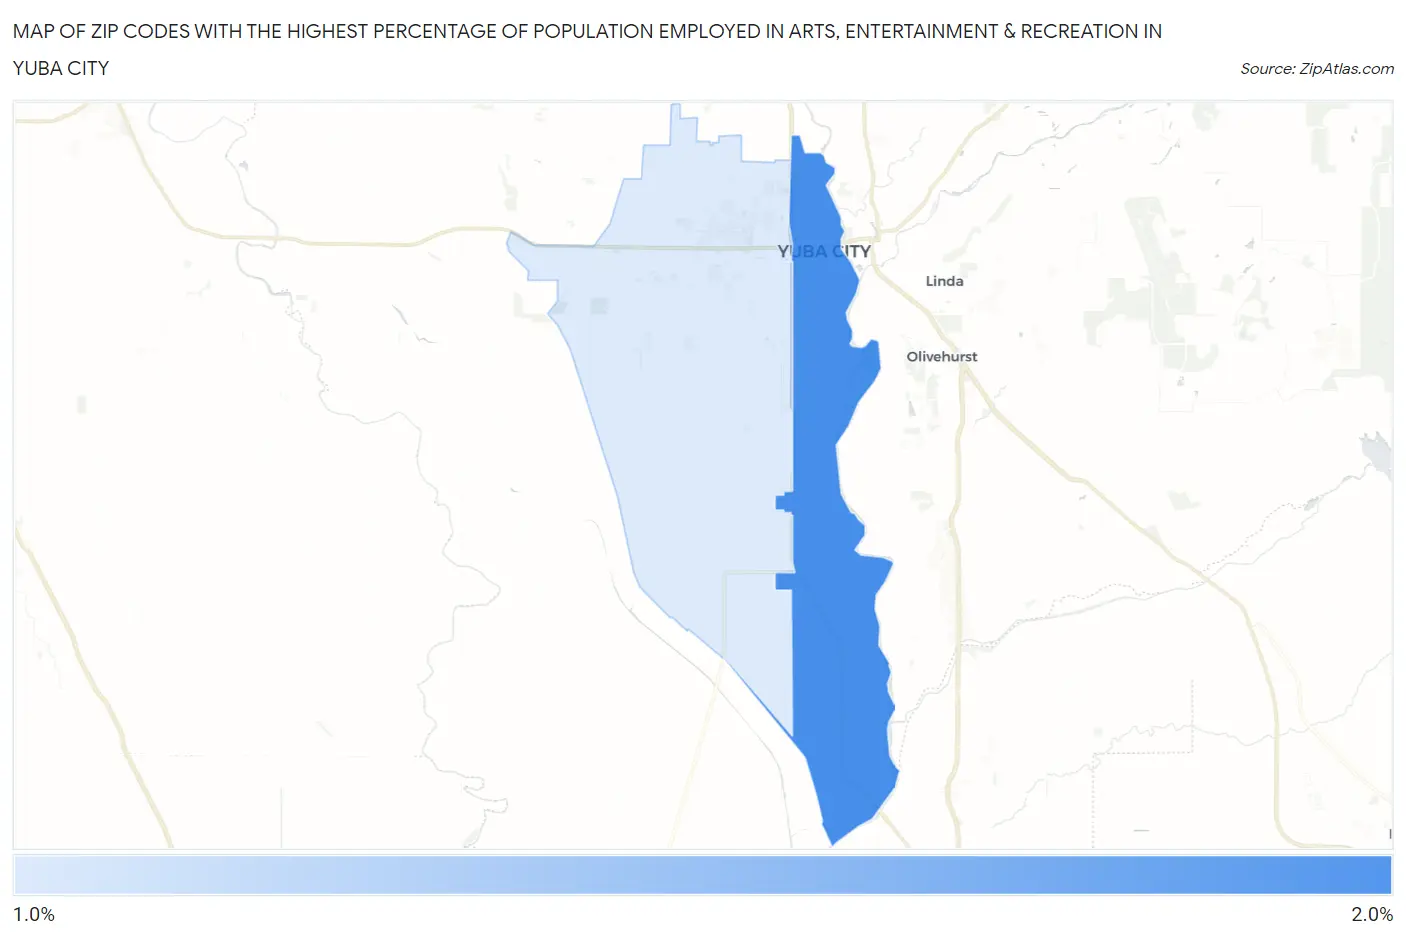
Map of Zip Codes with the Highest Percentage of Population Employed in Arts, Entertainment & Recreation in Yuba City
1.5%
1.6%
Zip Codes with the Highest Percentage of Population Employed in Arts, Entertainment & Recreation in Yuba City, CA
| Zip Code | % Employed | vs State | vs National | |
| 1. | 95991 | 1.6% | 2.6%(-0.981)#1,095 | 2.1%(-0.510)#12,675 |
| 2. | 95993 | 1.5% | 2.6%(-1.01)#1,101 | 2.1%(-0.534)#12,877 |
1
Common Questions
What are the Top Zip Codes with the Highest Percentage of Population Employed in Arts, Entertainment & Recreation in Yuba City, CA?
Top Zip Codes with the Highest Percentage of Population Employed in Arts, Entertainment & Recreation in Yuba City, CA are:
What zip code has the Highest Percentage of Population Employed in Arts, Entertainment & Recreation in Yuba City, CA?
95991 has the Highest Percentage of Population Employed in Arts, Entertainment & Recreation in Yuba City, CA with 1.6%.
What is the Percentage of Population Employed in Arts, Entertainment & Recreation in Yuba City, CA?
Percentage of Population Employed in Arts, Entertainment & Recreation in Yuba City is 1.5%.
What is the Percentage of Population Employed in Arts, Entertainment & Recreation in California?
Percentage of Population Employed in Arts, Entertainment & Recreation in California is 2.6%.
What is the Percentage of Population Employed in Arts, Entertainment & Recreation in the United States?
Percentage of Population Employed in Arts, Entertainment & Recreation in the United States is 2.1%.