Zip Codes with the Highest Percentage of Population Employed in Arts, Entertainment & Recreation in Turlock, CA
RELATED REPORTS & OPTIONS
Arts, Entertainment & Recreation
Turlock
Compare Zip Codes
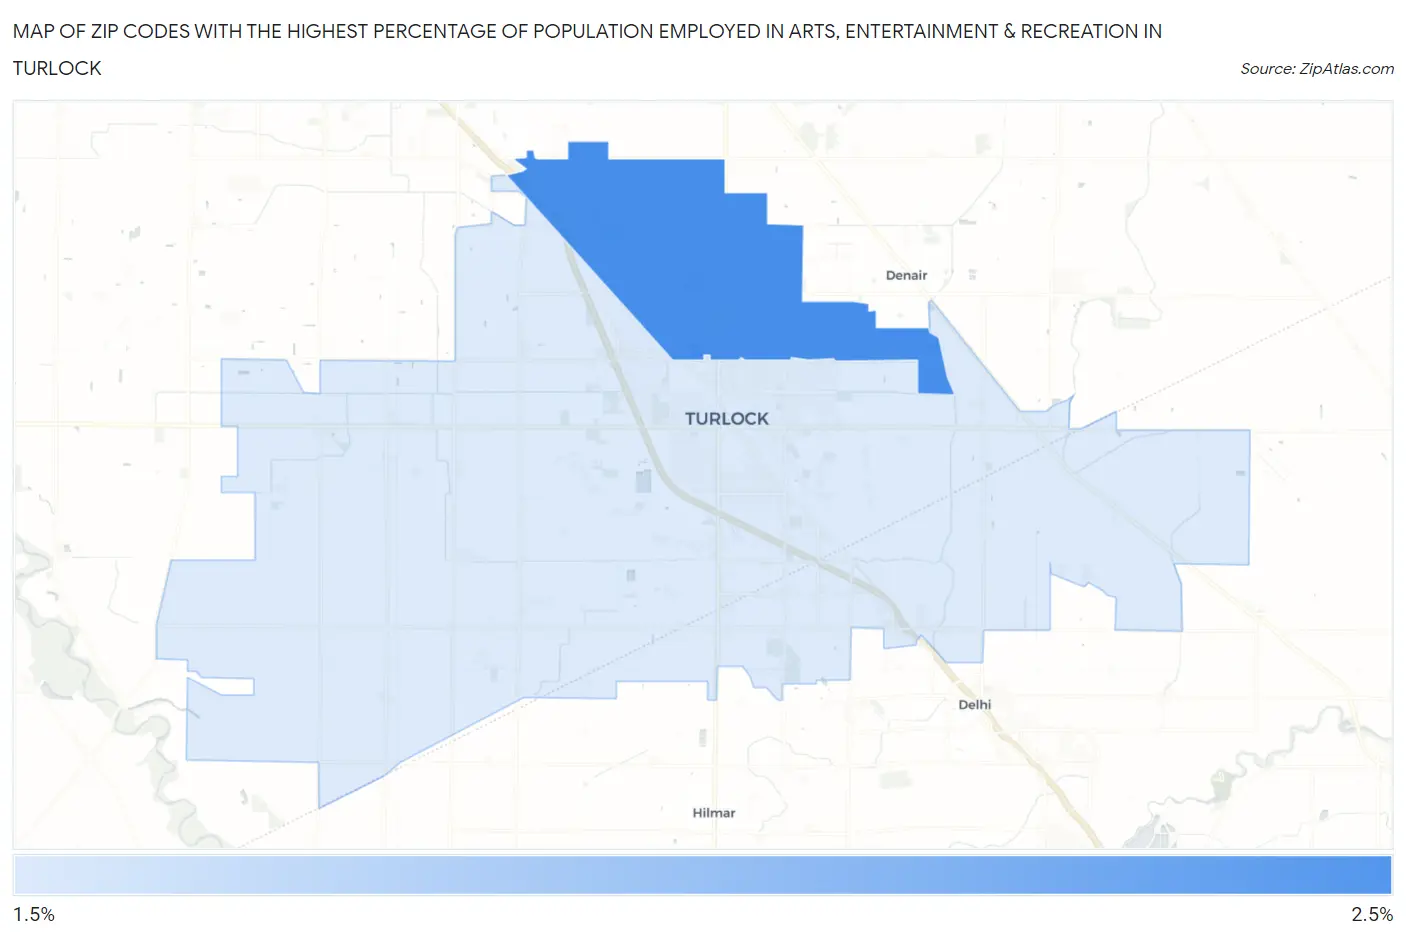
Map of Zip Codes with the Highest Percentage of Population Employed in Arts, Entertainment & Recreation in Turlock
1.9%
2.1%
Zip Codes with the Highest Percentage of Population Employed in Arts, Entertainment & Recreation in Turlock, CA
| Zip Code | % Employed | vs State | vs National | |
| 1. | 95382 | 2.1% | 2.6%(-0.453)#877 | 2.1%(+0.018)#9,210 |
| 2. | 95380 | 1.9% | 2.6%(-0.683)#970 | 2.1%(-0.212)#10,548 |
1
Common Questions
What are the Top Zip Codes with the Highest Percentage of Population Employed in Arts, Entertainment & Recreation in Turlock, CA?
Top Zip Codes with the Highest Percentage of Population Employed in Arts, Entertainment & Recreation in Turlock, CA are:
What zip code has the Highest Percentage of Population Employed in Arts, Entertainment & Recreation in Turlock, CA?
95382 has the Highest Percentage of Population Employed in Arts, Entertainment & Recreation in Turlock, CA with 2.1%.
What is the Percentage of Population Employed in Arts, Entertainment & Recreation in Turlock, CA?
Percentage of Population Employed in Arts, Entertainment & Recreation in Turlock is 1.9%.
What is the Percentage of Population Employed in Arts, Entertainment & Recreation in California?
Percentage of Population Employed in Arts, Entertainment & Recreation in California is 2.6%.
What is the Percentage of Population Employed in Arts, Entertainment & Recreation in the United States?
Percentage of Population Employed in Arts, Entertainment & Recreation in the United States is 2.1%.