Zip Codes with the Highest Percentage of Population Employed in Arts, Entertainment & Recreation in Manteca, CA
RELATED REPORTS & OPTIONS
Arts, Entertainment & Recreation
Manteca
Compare Zip Codes
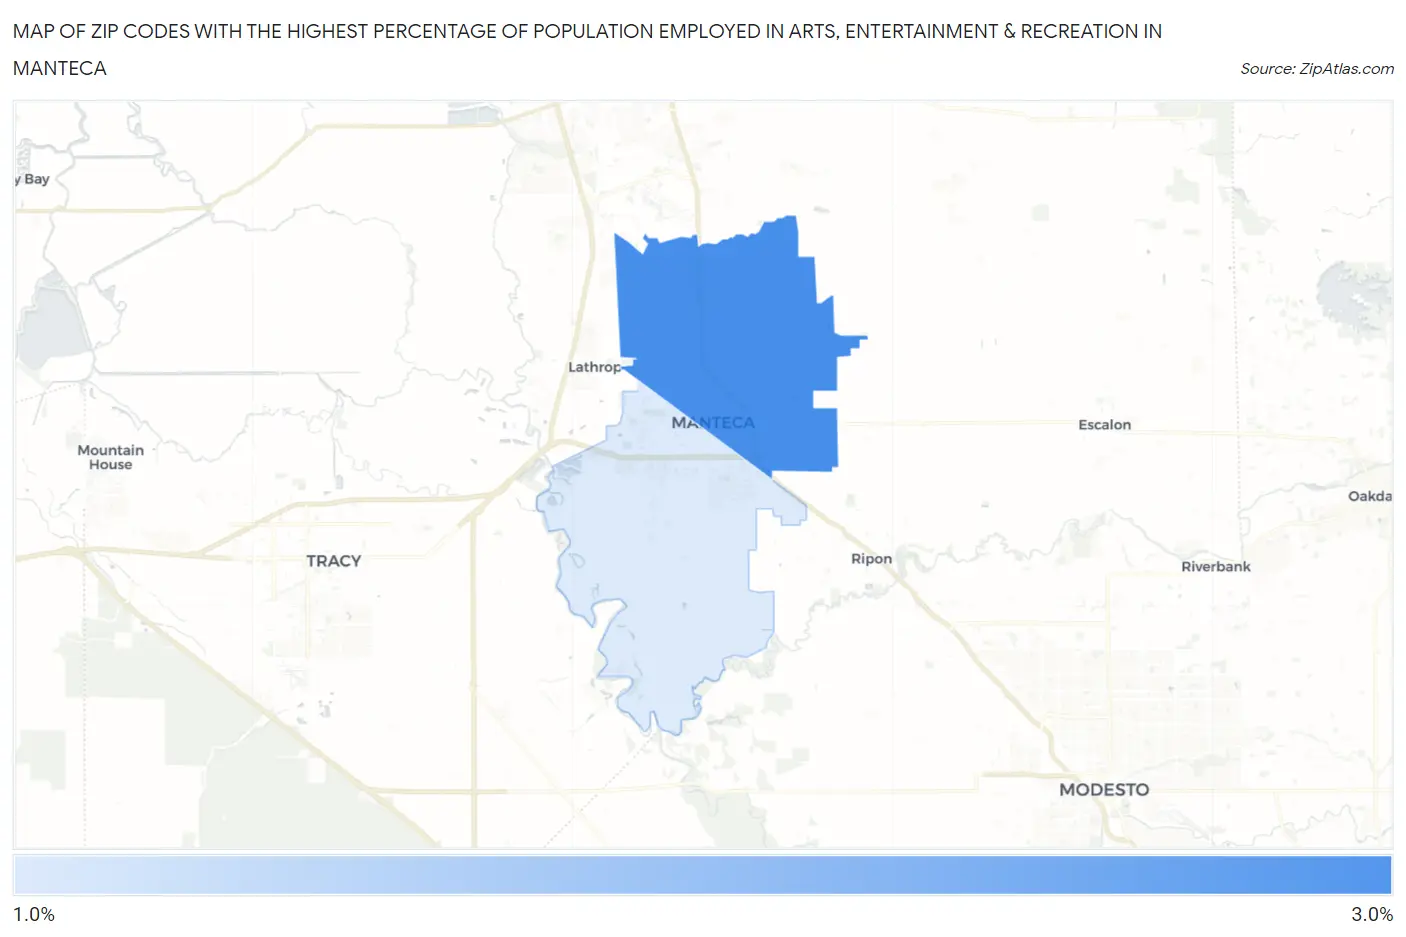
Map of Zip Codes with the Highest Percentage of Population Employed in Arts, Entertainment & Recreation in Manteca
1.4%
2.6%
Zip Codes with the Highest Percentage of Population Employed in Arts, Entertainment & Recreation in Manteca, CA
| Zip Code | % Employed | vs State | vs National | |
| 1. | 95336 | 2.6% | 2.6%(+0.042)#637 | 2.1%(+0.514)#6,776 |
| 2. | 95337 | 1.4% | 2.6%(-1.16)#1,167 | 2.1%(-0.687)#14,020 |
1
Common Questions
What are the Top Zip Codes with the Highest Percentage of Population Employed in Arts, Entertainment & Recreation in Manteca, CA?
Top Zip Codes with the Highest Percentage of Population Employed in Arts, Entertainment & Recreation in Manteca, CA are:
What zip code has the Highest Percentage of Population Employed in Arts, Entertainment & Recreation in Manteca, CA?
95336 has the Highest Percentage of Population Employed in Arts, Entertainment & Recreation in Manteca, CA with 2.6%.
What is the Percentage of Population Employed in Arts, Entertainment & Recreation in Manteca, CA?
Percentage of Population Employed in Arts, Entertainment & Recreation in Manteca is 2.2%.
What is the Percentage of Population Employed in Arts, Entertainment & Recreation in California?
Percentage of Population Employed in Arts, Entertainment & Recreation in California is 2.6%.
What is the Percentage of Population Employed in Arts, Entertainment & Recreation in the United States?
Percentage of Population Employed in Arts, Entertainment & Recreation in the United States is 2.1%.