Zip Codes with the Highest Percentage of Population Employed in Arts, Entertainment & Recreation in Chula Vista, CA
RELATED REPORTS & OPTIONS
Arts, Entertainment & Recreation
Chula Vista
Compare Zip Codes
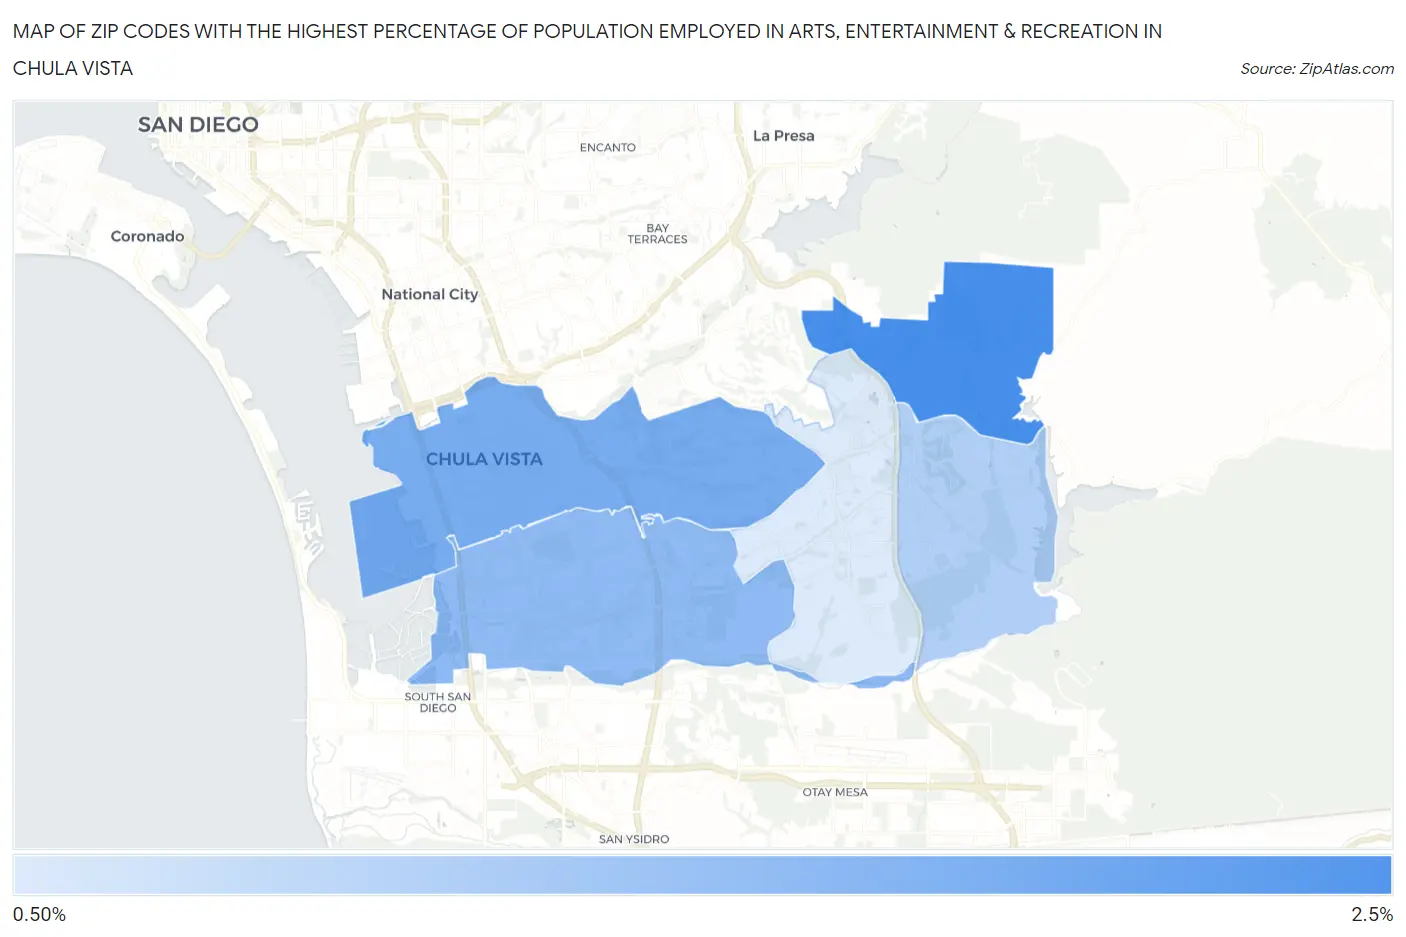
Map of Zip Codes with the Highest Percentage of Population Employed in Arts, Entertainment & Recreation in Chula Vista
1.2%
2.1%
Zip Codes with the Highest Percentage of Population Employed in Arts, Entertainment & Recreation in Chula Vista, CA
| Zip Code | % Employed | vs State | vs National | |
| 1. | 91914 | 2.1% | 2.6%(-0.450)#876 | 2.1%(+0.021)#9,188 |
| 2. | 91910 | 1.8% | 2.6%(-0.731)#988 | 2.1%(-0.260)#10,855 |
| 3. | 91911 | 1.7% | 2.6%(-0.857)#1,044 | 2.1%(-0.386)#11,752 |
| 4. | 91915 | 1.5% | 2.6%(-1.06)#1,134 | 2.1%(-0.589)#13,268 |
| 5. | 91913 | 1.2% | 2.6%(-1.31)#1,221 | 2.1%(-0.838)#15,147 |
1
Common Questions
What are the Top 3 Zip Codes with the Highest Percentage of Population Employed in Arts, Entertainment & Recreation in Chula Vista, CA?
Top 3 Zip Codes with the Highest Percentage of Population Employed in Arts, Entertainment & Recreation in Chula Vista, CA are:
What zip code has the Highest Percentage of Population Employed in Arts, Entertainment & Recreation in Chula Vista, CA?
91914 has the Highest Percentage of Population Employed in Arts, Entertainment & Recreation in Chula Vista, CA with 2.1%.
What is the Percentage of Population Employed in Arts, Entertainment & Recreation in Chula Vista, CA?
Percentage of Population Employed in Arts, Entertainment & Recreation in Chula Vista is 1.6%.
What is the Percentage of Population Employed in Arts, Entertainment & Recreation in California?
Percentage of Population Employed in Arts, Entertainment & Recreation in California is 2.6%.
What is the Percentage of Population Employed in Arts, Entertainment & Recreation in the United States?
Percentage of Population Employed in Arts, Entertainment & Recreation in the United States is 2.1%.