Zip Codes with the Highest Percentage of Population Employed in Arts, Entertainment & Recreation in Los Altos, CA
RELATED REPORTS & OPTIONS
Arts, Entertainment & Recreation
Los Altos
Compare Zip Codes
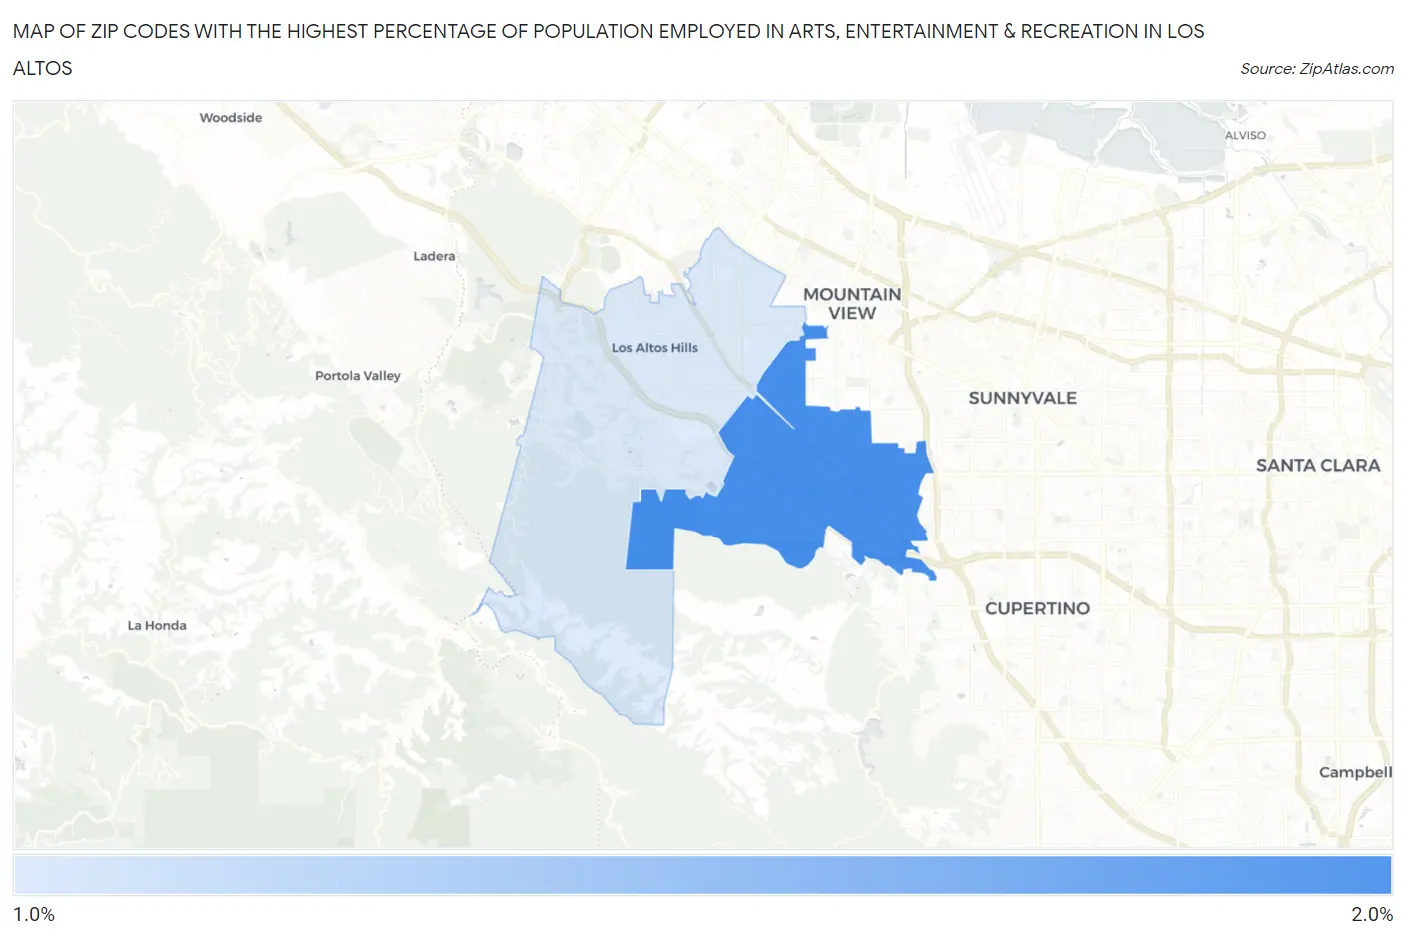
Map of Zip Codes with the Highest Percentage of Population Employed in Arts, Entertainment & Recreation in Los Altos
1.6%
1.6%
Zip Codes with the Highest Percentage of Population Employed in Arts, Entertainment & Recreation in Los Altos, CA
| Zip Code | % Employed | vs State | vs National | |
| 1. | 94024 | 1.6% | 2.6%(-0.918)#1,068 | 2.1%(-0.447)#12,186 |
| 2. | 94022 | 1.6% | 2.6%(-0.955)#1,083 | 2.1%(-0.484)#12,466 |
1
Common Questions
What are the Top Zip Codes with the Highest Percentage of Population Employed in Arts, Entertainment & Recreation in Los Altos, CA?
Top Zip Codes with the Highest Percentage of Population Employed in Arts, Entertainment & Recreation in Los Altos, CA are:
What zip code has the Highest Percentage of Population Employed in Arts, Entertainment & Recreation in Los Altos, CA?
94024 has the Highest Percentage of Population Employed in Arts, Entertainment & Recreation in Los Altos, CA with 1.6%.
What is the Percentage of Population Employed in Arts, Entertainment & Recreation in Los Altos, CA?
Percentage of Population Employed in Arts, Entertainment & Recreation in Los Altos is 1.4%.
What is the Percentage of Population Employed in Arts, Entertainment & Recreation in California?
Percentage of Population Employed in Arts, Entertainment & Recreation in California is 2.6%.
What is the Percentage of Population Employed in Arts, Entertainment & Recreation in the United States?
Percentage of Population Employed in Arts, Entertainment & Recreation in the United States is 2.1%.