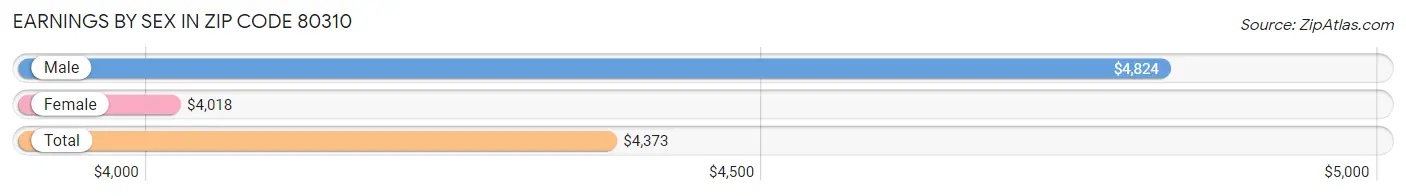
Average Earnings in Zip Code 80310 are $4,373, $4,824 for men and $4,018 for women, a difference of 16.7%.
Sex
Number
Average Earnings
Male
2,530 (50.4%)
$4,824
Female
2,490 (49.6%)
$4,018
Total
5,020 (100.0%)
$4,373
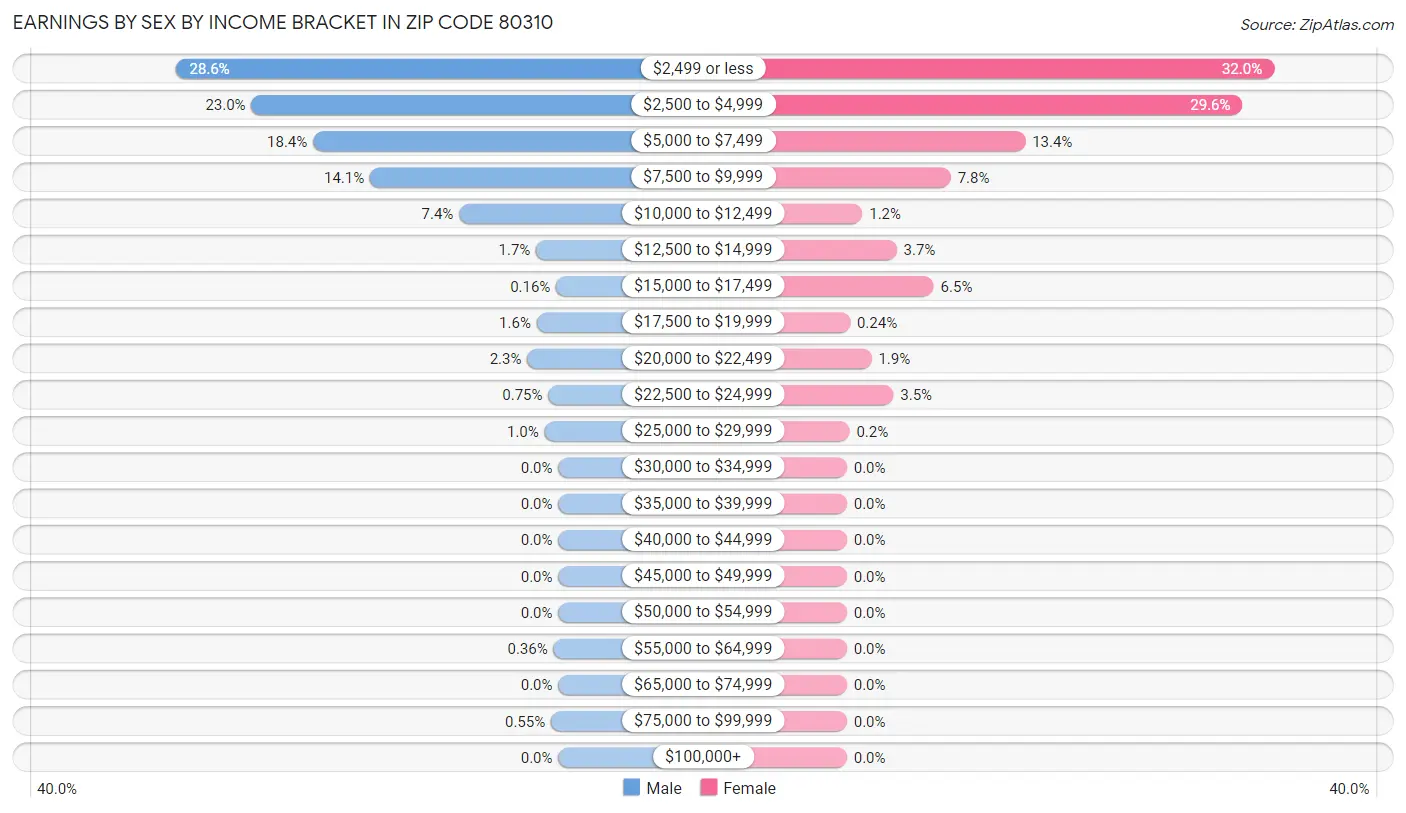
Earnings by Sex by Income Bracket in Zip Code 80310
The most common earnings brackets in Zip Code 80310 are $2,499 or less for men (724 | 28.6%) and $2,499 or less for women (797 | 32.0%).
Income
Male
Female
$2,499 or less
724 (28.6%)
797 (32.0%)
$2,500 to $4,999
582 (23.0%)
738 (29.6%)
$5,000 to $7,499
465 (18.4%)
333 (13.4%)
$7,500 to $9,999
357 (14.1%)
194 (7.8%)
$10,000 to $12,499
188 (7.4%)
29 (1.2%)
$12,500 to $14,999
42 (1.7%)
93 (3.7%)
$15,000 to $17,499
4 (0.2%)
162 (6.5%)
$17,500 to $19,999
41 (1.6%)
6 (0.2%)
$20,000 to $22,499
59 (2.3%)
46 (1.8%)
$22,500 to $24,999
19 (0.7%)
87 (3.5%)
$25,000 to $29,999
26 (1.0%)
5 (0.2%)
$30,000 to $34,999
0 (0.0%)
0 (0.0%)
$35,000 to $39,999
0 (0.0%)
0 (0.0%)
$40,000 to $44,999
0 (0.0%)
0 (0.0%)
$45,000 to $49,999
0 (0.0%)
0 (0.0%)
$50,000 to $54,999
0 (0.0%)
0 (0.0%)
$55,000 to $64,999
9 (0.4%)
0 (0.0%)
$65,000 to $74,999
0 (0.0%)
0 (0.0%)
$75,000 to $99,999
14 (0.5%)
0 (0.0%)
$100,000+
0 (0.0%)
0 (0.0%)
Total
2,530 (100.0%)
2,490 (100.0%)
Earnings by Sex by Educational Attainment in Zip Code 80310
Educational Attainment
Male Income
Female Income
Less than High School
-
-
High School Diploma
-
-
College or Associate's Degree
-
-
Bachelor's Degree
-
-
Graduate Degree
-
-
Total
-
-
Family Income in Zip Code 80310
Family Income Brackets in Zip Code 80310
Income Bracket
# Families
% Families
Less than $10,000
0
0.0%
$10,000 to $14,999
0
0.0%
$15,000 to $24,999
0
0.0%
$25,000 to $34,999
0
0.0%
$35,000 to $49,999
0
0.0%
$50,000 to $74,999
0
0.0%
$75,000 to $99,999
0
0.0%
$100,000 to $149,999
0
0.0%
$150,000 to $199,999
0
0.0%
$200,000+
0
0.0%
Family Income by Famaliy Size in Zip Code 80310
Income Bracket
# Families
Median Income
2-Person Families
0 (0.0%)
$0
3-Person Families
0 (0.0%)
$0
4-Person Families
0 (0.0%)
$0
5-Person Families
0 (0.0%)
$0
6-Person Families
0 (0.0%)
$0
7+ Person Families
0 (0.0%)
$0
Total
0 (0.0%)
$0
Family Income by Number of Earners in Zip Code 80310
Number of Earners
# Families
Median Income
No Earners
0 (0.0%)
$0
1 Earner
0 (0.0%)
$0
2 Earners
0 (0.0%)
$0
3+ Earners
0 (0.0%)
$0
Total
0 (0.0%)
$0
Household Income in Zip Code 80310
Household Income Brackets in Zip Code 80310
Income Bracket
# Households
% Households
Less than $10,000
0
0.0%
$10,000 to $14,999
0
0.0%
$15,000 to $24,999
0
0.0%
$25,000 to $34,999
0
0.0%
$35,000 to $49,999
0
0.0%
$50,000 to $74,999
0
0.0%
$75,000 to $99,999
0
0.0%
$100,000 to $149,999
0
0.0%
$150,000 to $199,999
0
0.0%
$200,000+
0
0.0%
Household Income by Householder Age in Zip Code 80310
Income Bracket
# Households
Median Income
15 to 24 Years
0 (0.0%)
$0
25 to 44 Years
0 (0.0%)
$0
45 to 64 Years
0 (0.0%)
$0
65+ Years
0 (0.0%)
$0
Total
0 (0.0%)
$0
Poverty in Zip Code 80310
Income Below Poverty by Sex and Age in Zip Code 80310
Age Bracket
Male
Female
Under 5 Years
0 (0.0%)
0 (0.0%)
5 Years
0 (0.0%)
0 (0.0%)
6 to 11 Years
0 (0.0%)
0 (0.0%)
12 to 14 Years
0 (0.0%)
0 (0.0%)
15 Years
0 (0.0%)
0 (0.0%)
16 and 17 Years
0 (0.0%)
0 (0.0%)
18 to 24 Years
0 (0.0%)
0 (0.0%)
25 to 34 Years
0 (0.0%)
0 (0.0%)
35 to 44 Years
0 (0.0%)
0 (0.0%)
45 to 54 Years
0 (0.0%)
0 (0.0%)
55 to 64 Years
0 (0.0%)
0 (0.0%)
65 to 74 Years
0 (0.0%)
0 (0.0%)
75 Years and over
0 (0.0%)
0 (0.0%)
Total
0 (0.0%)
0 (0.0%)
Income Above Poverty by Sex and Age in Zip Code 80310
Age Bracket
Male
Female
Under 5 Years
0 (0.0%)
0 (0.0%)
5 Years
0 (0.0%)
0 (0.0%)
6 to 11 Years
0 (0.0%)
0 (0.0%)
12 to 14 Years
0 (0.0%)
0 (0.0%)
15 Years
0 (0.0%)
0 (0.0%)
16 and 17 Years
0 (0.0%)
0 (0.0%)
18 to 24 Years
0 (0.0%)
0 (0.0%)
25 to 34 Years
0 (0.0%)
0 (0.0%)
35 to 44 Years
0 (0.0%)
0 (0.0%)
45 to 54 Years
0 (0.0%)
0 (0.0%)
55 to 64 Years
0 (0.0%)
0 (0.0%)
65 to 74 Years
0 (0.0%)
0 (0.0%)
75 Years and over
0 (0.0%)
0 (0.0%)
Total
0 (0.0%)
0 (0.0%)
Income Below Poverty Among Married-Couple Families in Zip Code 80310
Children
Above Poverty
Below Poverty
No Children
0 (0.0%)
0 (0.0%)
1 or 2 Children
0 (0.0%)
0 (0.0%)
3 or 4 Children
0 (0.0%)
0 (0.0%)
5 or more Children
0 (0.0%)
0 (0.0%)
Total
0 (0.0%)
0 (0.0%)
Income Below Poverty Among Single-Parent Households in Zip Code 80310
Children
Single Father
Single Mother
No Children
0 (0.0%)
0 (0.0%)
1 or 2 Children
0 (0.0%)
0 (0.0%)
3 or 4 Children
0 (0.0%)
0 (0.0%)
5 or more Children
0 (0.0%)
0 (0.0%)
Total
0 (0.0%)
0 (0.0%)
Income Below Poverty Among Married-Couple vs Single-Parent Households in Zip Code 80310
Children
Married-Couple Families
Single-Parent Households
No Children
0 (0.0%)
0 (0.0%)
1 or 2 Children
0 (0.0%)
0 (0.0%)
3 or 4 Children
0 (0.0%)
0 (0.0%)
5 or more Children
0 (0.0%)
0 (0.0%)
Total
0 (0.0%)
0 (0.0%)
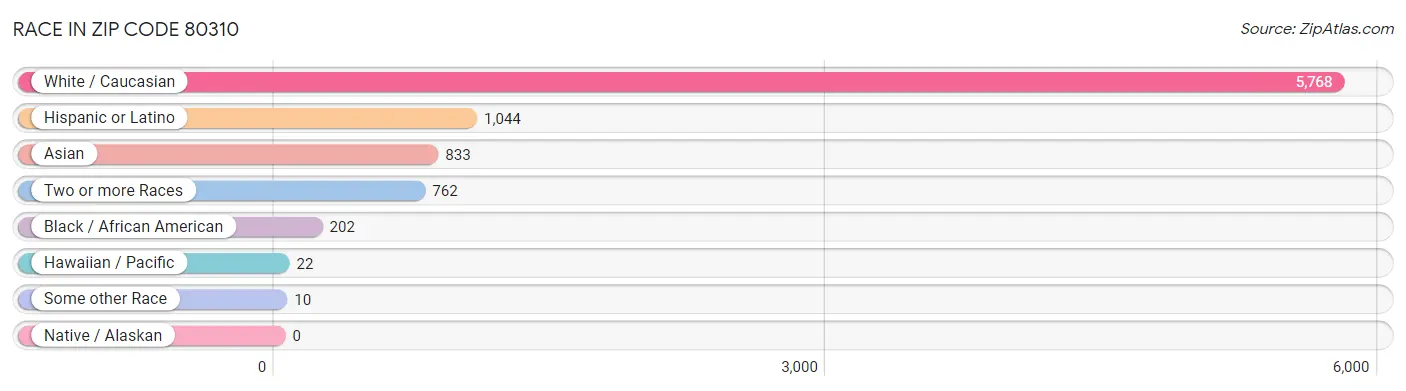
Race in Zip Code 80310
The most populous races in Zip Code 80310 are White / Caucasian (5,768 | 75.9%), Hispanic or Latino (1,044 | 13.7%), and Asian (833 | 11.0%).
Race
# Population
% Population
Asian
833
11.0%
Black / African American
202
2.7%
Hawaiian / Pacific
22
0.3%
Hispanic or Latino
1,044
13.7%
Native / Alaskan
0
0.0%
White / Caucasian
5,768
75.9%
Two or more Races
762
10.0%
Some other Race
10
0.1%
Total
7,597
100.0%
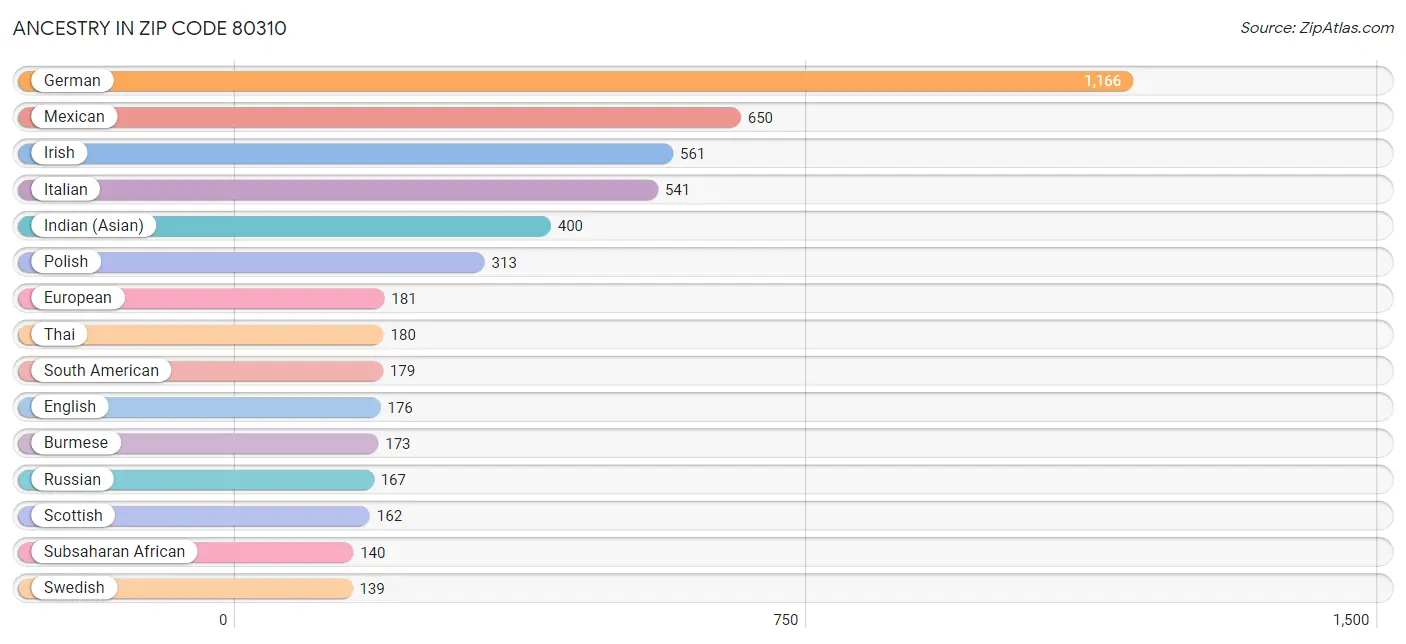
Ancestry in Zip Code 80310
The most populous ancestries reported in Zip Code 80310 are German (1,166 | 15.3%), Mexican (650 | 8.6%), Irish (561 | 7.4%), Italian (541 | 7.1%), and Indian (Asian) (400 | 5.3%), together accounting for 43.7% of all Zip Code 80310 residents.
Ancestry
# Population
% Population
African
52
0.7%
Arab
76
1.0%
Argentinean
18
0.2%
Austrian
13
0.2%
Bhutanese
35
0.5%
Bolivian
26
0.3%
Brazilian
31
0.4%
British
110
1.5%
Burmese
173
2.3%
Canadian
42
0.5%
Celtic
18
0.2%
Central American
40
0.5%
Chilean
4
0.1%
Chippewa
4
0.1%
Colombian
78
1.0%
Cuban
75
1.0%
Czech
8
0.1%
Danish
42
0.5%
Dominican
8
0.1%
Dutch
38
0.5%
Eastern European
17
0.2%
English
176
2.3%
Ethiopian
88
1.2%
European
181
2.4%
Filipino
42
0.5%
Finnish
19
0.3%
French
98
1.3%
French Canadian
35
0.5%
German
1,166
15.3%
Greek
40
0.5%
Honduran
13
0.2%
Hungarian
33
0.4%
Indian (Asian)
400
5.3%
Iranian
17
0.2%
Irish
561
7.4%
Israeli
5
0.1%
Italian
541
7.1%
Korean
24
0.3%
Lebanese
27
0.4%
Lumbee
37
0.5%
Luxembourger
5
0.1%
Macedonian
24
0.3%
Malaysian
10
0.1%
Mexican
650
8.6%
Mongolian
5
0.1%
Native Hawaiian
22
0.3%
Norwegian
116
1.5%
Peruvian
53
0.7%
Polish
313
4.1%
Portuguese
6
0.1%
Puerto Rican
18
0.2%
Russian
167
2.2%
Salvadoran
27
0.4%
Scandinavian
9
0.1%
Scotch-Irish
68
0.9%
Scottish
162
2.1%
Slovene
14
0.2%
South American
179
2.4%
Spaniard
14
0.2%
Spanish
47
0.6%
Sri Lankan
69
0.9%
Subsaharan African
140
1.8%
Swedish
139
1.8%
Swiss
6
0.1%
Thai
180
2.4%
Turkish
9
0.1%
Ukrainian
68
0.9%
Welsh
12
0.2%
View All 68 Rows
Immigrants in Zip Code 80310
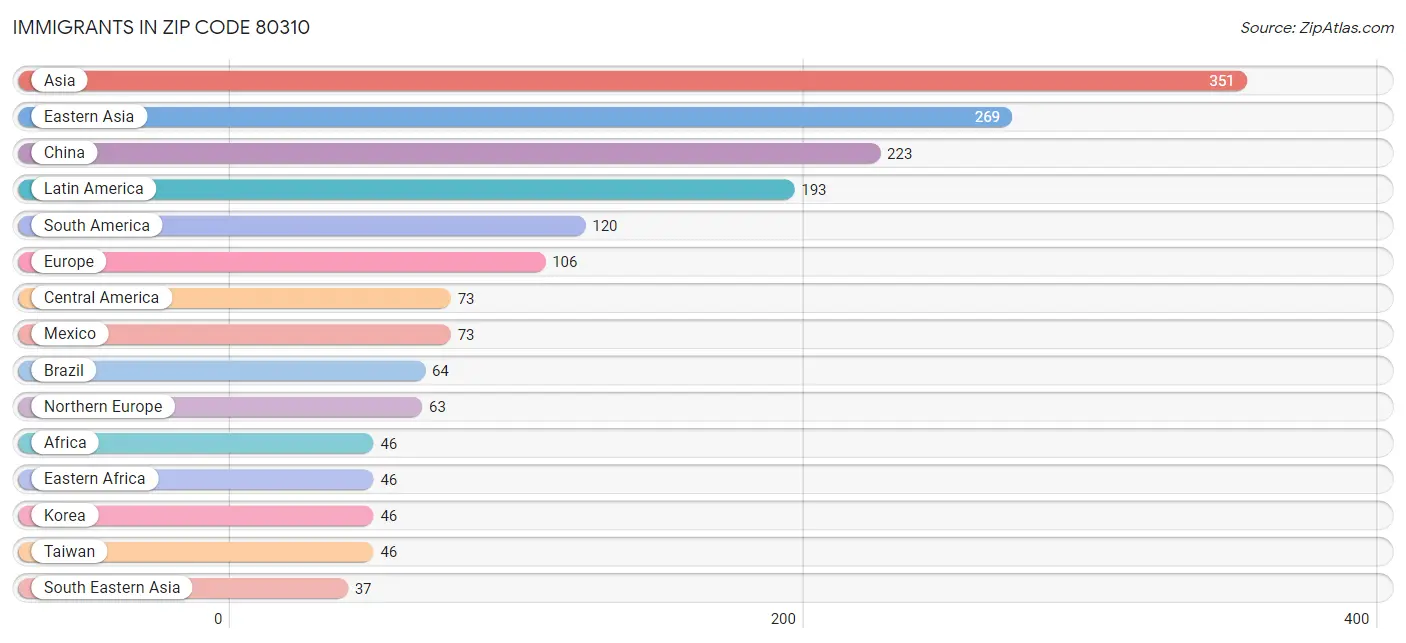
The most numerous immigrant groups reported in Zip Code 80310 came from Asia (351 | 4.6%), Eastern Asia (269 | 3.5%), China (223 | 2.9%), Latin America (193 | 2.5%), and South America (120 | 1.6%), together accounting for 15.2% of all Zip Code 80310 residents.
Immigration Origin
# Population
% Population
Africa
46
0.6%
Asia
351
4.6%
Brazil
64
0.8%
Canada
28
0.4%
Central America
73
1.0%
Chile
19
0.3%
China
223
2.9%
Colombia
30
0.4%
Eastern Africa
46
0.6%
Eastern Asia
269
3.5%
Eastern Europe
24
0.3%
Ecuador
7
0.1%
Ethiopia
36
0.5%
Europe
106
1.4%
India
29
0.4%
Iran
7
0.1%
Ireland
33
0.4%
Korea
46
0.6%
Latin America
193
2.5%
Malaysia
5
0.1%
Mexico
73
1.0%
Netherlands
5
0.1%
North Macedonia
24
0.3%
Northern Europe
63
0.8%
Singapore
17
0.2%
South America
120
1.6%
South Central Asia
36
0.5%
South Eastern Asia
37
0.5%
Southern Europe
14
0.2%
Spain
14
0.2%
Taiwan
46
0.6%
Turkey
9
0.1%
Vietnam
15
0.2%
Western Asia
9
0.1%
Western Europe
5
0.1%
View All 35 Rows
Sex and Age in Zip Code 80310
Sex and Age in Zip Code 80310
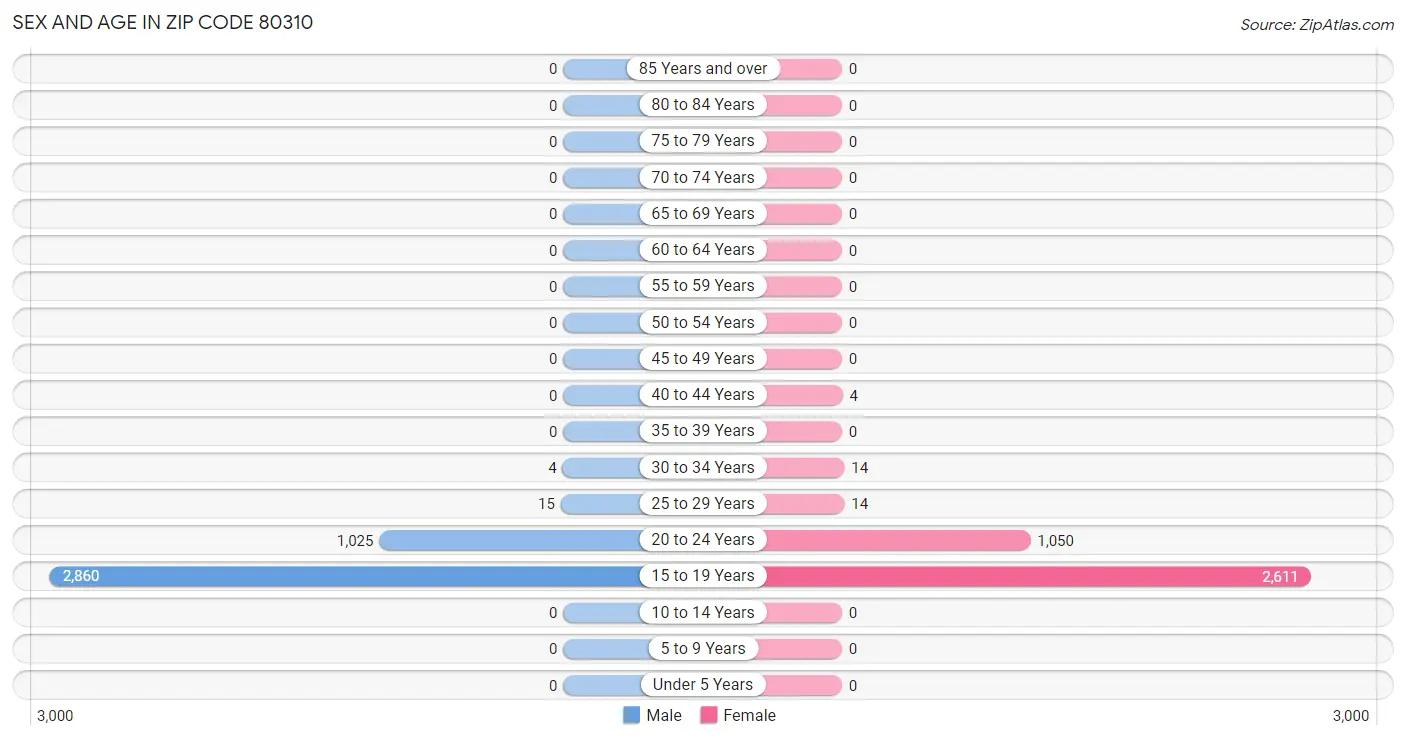
The most populous age groups in Zip Code 80310 are 15 to 19 Years (2,860 | 73.3%) for men and 15 to 19 Years (2,611 | 70.7%) for women.
Age Bracket
Male
Female
Under 5 Years
0 (0.0%)
0 (0.0%)
5 to 9 Years
0 (0.0%)
0 (0.0%)
10 to 14 Years
0 (0.0%)
0 (0.0%)
15 to 19 Years
2,860 (73.3%)
2,611 (70.7%)
20 to 24 Years
1,025 (26.3%)
1,050 (28.4%)
25 to 29 Years
15 (0.4%)
14 (0.4%)
30 to 34 Years
4 (0.1%)
14 (0.4%)
35 to 39 Years
0 (0.0%)
0 (0.0%)
40 to 44 Years
0 (0.0%)
4 (0.1%)
45 to 49 Years
0 (0.0%)
0 (0.0%)
50 to 54 Years
0 (0.0%)
0 (0.0%)
55 to 59 Years
0 (0.0%)
0 (0.0%)
60 to 64 Years
0 (0.0%)
0 (0.0%)
65 to 69 Years
0 (0.0%)
0 (0.0%)
70 to 74 Years
0 (0.0%)
0 (0.0%)
75 to 79 Years
0 (0.0%)
0 (0.0%)
80 to 84 Years
0 (0.0%)
0 (0.0%)
85 Years and over
0 (0.0%)
0 (0.0%)
Total
3,904 (100.0%)
3,693 (100.0%)
Families and Households in Zip Code 80310
Median Family Size in Zip Code 80310
Family Type
# Families
Family Size
Married-Couple
0 (0.0%)
-
Single Male/Father
0 (0.0%)
-
Single Female/Mother
0 (0.0%)
-
Total Families
0 (0.0%)
-
Median Household Size in Zip Code 80310
Household Type
# Households
Household Size
Married-Couple
0 (0.0%)
-
Single Male/Father
0 (0.0%)
-
Single Female/Mother
0 (0.0%)
-
Non-family
0 (0.0%)
-
Total Households
0 (0.0%)
-
Household Size by Marriage Status in Zip Code 80310
Household Size
Family Households
Nonfamily Households
1-Person Households
-
0 (0.0%)
2-Person Households
0 (0.0%)
0 (0.0%)
3-Person Households
0 (0.0%)
0 (0.0%)
4-Person Households
0 (0.0%)
0 (0.0%)
5-Person Households
0 (0.0%)
0 (0.0%)
6-Person Households
0 (0.0%)
0 (0.0%)
7+ Person Households
0 (0.0%)
0 (0.0%)
Total
0 (0.0%)
0 (0.0%)
Female Fertility in Zip Code 80310
Fertility by Age in Zip Code 80310
Age Bracket
Women with Births
Births / 1,000 Women
15 to 19 years
0 (0.0%)
0.0
20 to 34 years
0 (0.0%)
0.0
35 to 50 years
0 (0.0%)
0.0
Total
0 (0.0%)
0.0
Fertility by Age by Marriage Status in Zip Code 80310
Age Bracket
Married
Unmarried
15 to 19 years
0 (0.0%)
0 (0.0%)
20 to 34 years
0 (0.0%)
0 (0.0%)
35 to 50 years
0 (0.0%)
0 (0.0%)
Total
0 (0.0%)
0 (0.0%)
Fertility by Education in Zip Code 80310
Educational Attainment
Women with Births
Births / 1,000 Women
Less than High School
0 (0.0%)
0.0
High School Diploma
0 (0.0%)
0.0
College or Associate's Degree
0 (0.0%)
0.0
Bachelor's Degree
0 (0.0%)
0.0
Graduate Degree
0 (0.0%)
0.0
Total
0 (0.0%)
0.0
Fertility by Education by Marriage Status in Zip Code 80310
Educational Attainment
Married
Unmarried
Less than High School
0 (0.0%)
0 (0.0%)
High School Diploma
0 (0.0%)
0 (0.0%)
College or Associate's Degree
0 (0.0%)
0 (0.0%)
Bachelor's Degree
0 (0.0%)
0 (0.0%)
Graduate Degree
0 (0.0%)
0 (0.0%)
Total
0 (0.0%)
0 (0.0%)
Employment Characteristics in Zip Code 80310
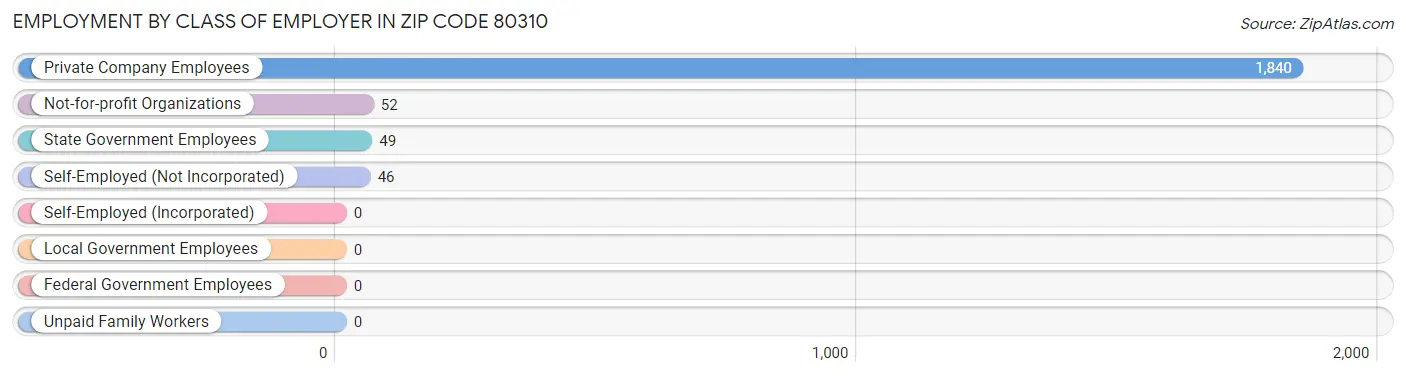
Employment by Class of Employer in Zip Code 80310
Among the 1,987 employed individuals in Zip Code 80310, private company employees (1,840 | 92.6%), not-for-profit organizations (52 | 2.6%), and state government employees (49 | 2.5%) make up the most common classes of employment.
Employer Class
# Employees
% Employees
Private Company Employees
1,840
92.6%
Self-Employed (Incorporated)
0
0.0%
Self-Employed (Not Incorporated)
46
2.3%
Not-for-profit Organizations
52
2.6%
Local Government Employees
0
0.0%
State Government Employees
49
2.5%
Federal Government Employees
0
0.0%
Unpaid Family Workers
0
0.0%
Total
1,987
100.0%
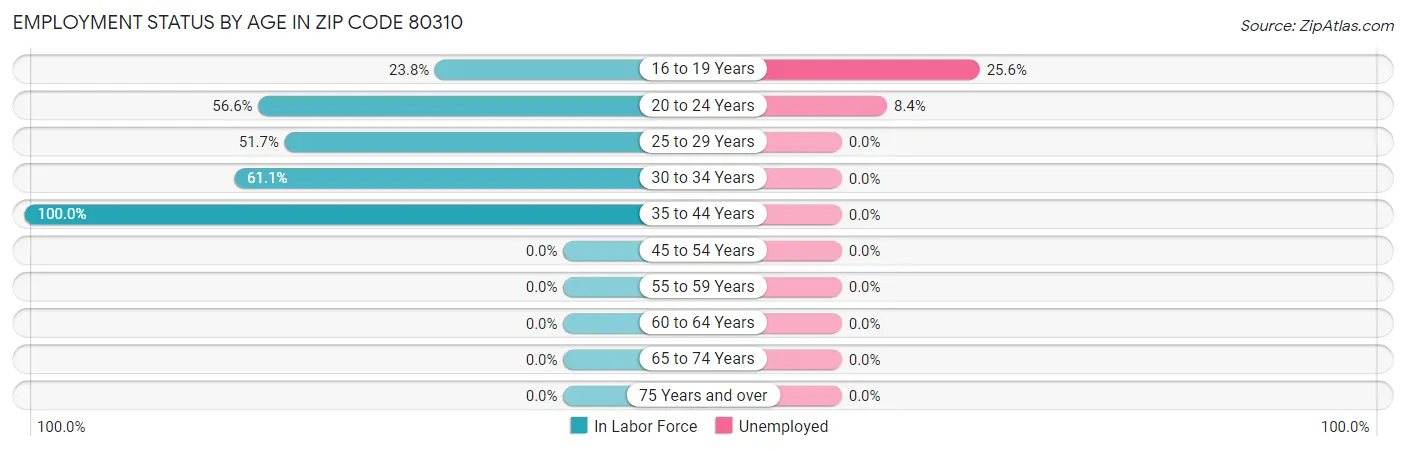
Employment Status by Age in Zip Code 80310
According to the labor force statistics for Zip Code 80310, out of the total population over 16 years of age (7,597), 33.0% or 2,507 individuals are in the labor force, with 17.2% or 431 of them unemployed. The age group with the highest labor force participation rate is 35 to 44 years, with 100.0% or 4 individuals in the labor force. Within the labor force, the 16 to 19 years age range has the highest percentage of unemployed individuals, with 25.6% or 333 of them being unemployed.
Age Bracket
In Labor Force
Unemployed
16 to 19 Years
1,302 (23.8%)
333 (25.6%)
20 to 24 Years
1,174 (56.6%)
99 (8.4%)
25 to 29 Years
15 (51.7%)
0 (0.0%)
30 to 34 Years
11 (61.1%)
0 (0.0%)
35 to 44 Years
4 (100.0%)
0 (0.0%)
45 to 54 Years
0 (0.0%)
0 (0.0%)
55 to 59 Years
0 (0.0%)
0 (0.0%)
60 to 64 Years
0 (0.0%)
0 (0.0%)
65 to 74 Years
0 (0.0%)
0 (0.0%)
75 Years and over
0 (0.0%)
0 (0.0%)
Total
2,507 (33.0%)
431 (17.2%)
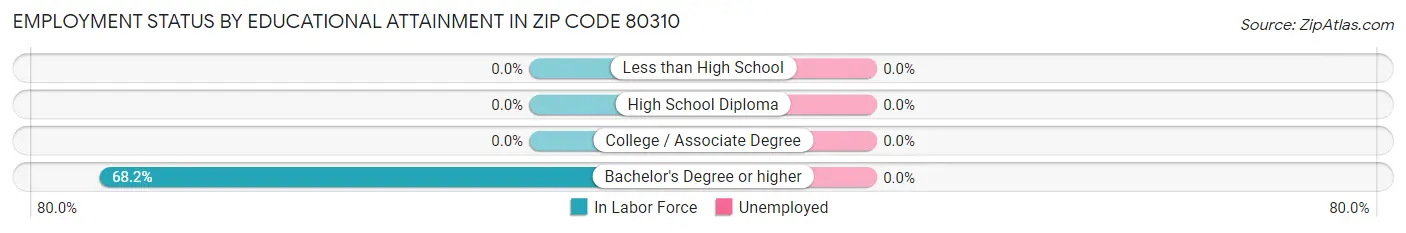
Employment Status by Educational Attainment in Zip Code 80310
Educational Attainment
In Labor Force
Unemployed
Less than High School
0 (0.0%)
0 (0.0%)
High School Diploma
0 (0.0%)
0 (0.0%)
College / Associate Degree
0 (0.0%)
0 (0.0%)
Bachelor's Degree or higher
30 (68.2%)
0 (0.0%)
Total
30 (58.8%)
0 (0.0%)
Employment Occupations by Sex in Zip Code 80310
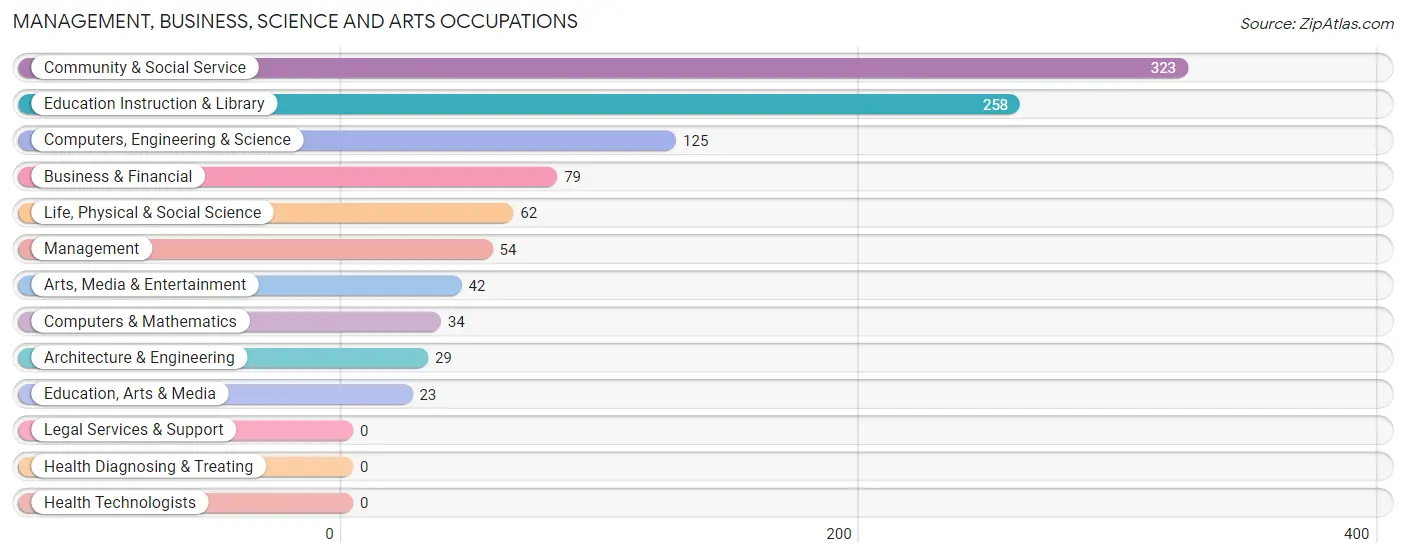
Management, Business, Science and Arts Occupations
The most common Management, Business, Science and Arts occupations in Zip Code 80310 are Community & Social Service (323 | 15.6%), Education Instruction & Library (258 | 12.4%), Computers, Engineering & Science (125 | 6.0%), Business & Financial (79 | 3.8%), and Life, Physical & Social Science (62 | 3.0%).
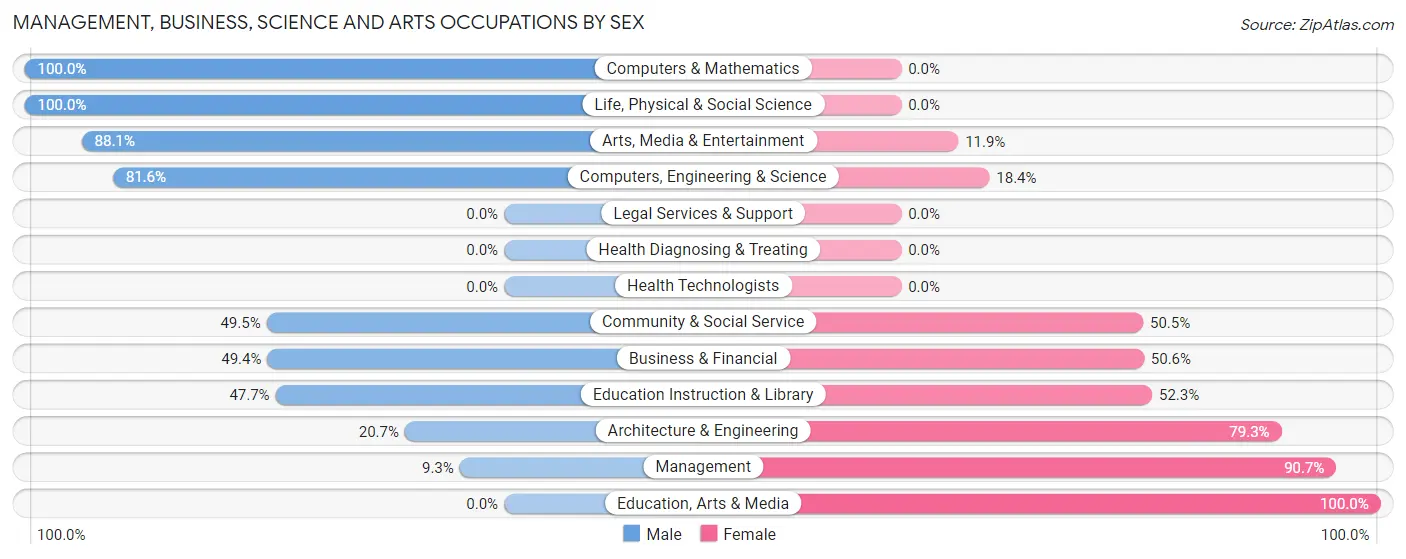
Management, Business, Science and Arts Occupations by Sex
Within the Management, Business, Science and Arts occupations in Zip Code 80310, the most male-oriented occupations are Computers & Mathematics (100.0%), Life, Physical & Social Science (100.0%), and Arts, Media & Entertainment (88.1%), while the most female-oriented occupations are Education, Arts & Media (100.0%), Management (90.7%), and Architecture & Engineering (79.3%).
Occupation
Male
Female
Management
5 (9.3%)
49 (90.7%)
Business & Financial
39 (49.4%)
40 (50.6%)
Computers, Engineering & Science
102 (81.6%)
23 (18.4%)
Computers & Mathematics
34 (100.0%)
0 (0.0%)
Architecture & Engineering
6 (20.7%)
23 (79.3%)
Life, Physical & Social Science
62 (100.0%)
0 (0.0%)
Community & Social Service
160 (49.5%)
163 (50.5%)
Education, Arts & Media
0 (0.0%)
23 (100.0%)
Legal Services & Support
0 (0.0%)
0 (0.0%)
Education Instruction & Library
123 (47.7%)
135 (52.3%)
Arts, Media & Entertainment
37 (88.1%)
5 (11.9%)
Health Diagnosing & Treating
0 (0.0%)
0 (0.0%)
Health Technologists
0 (0.0%)
0 (0.0%)
Total (Category)
306 (52.7%)
275 (47.3%)
Total (Overall)
835 (40.3%)
1,239 (59.7%)
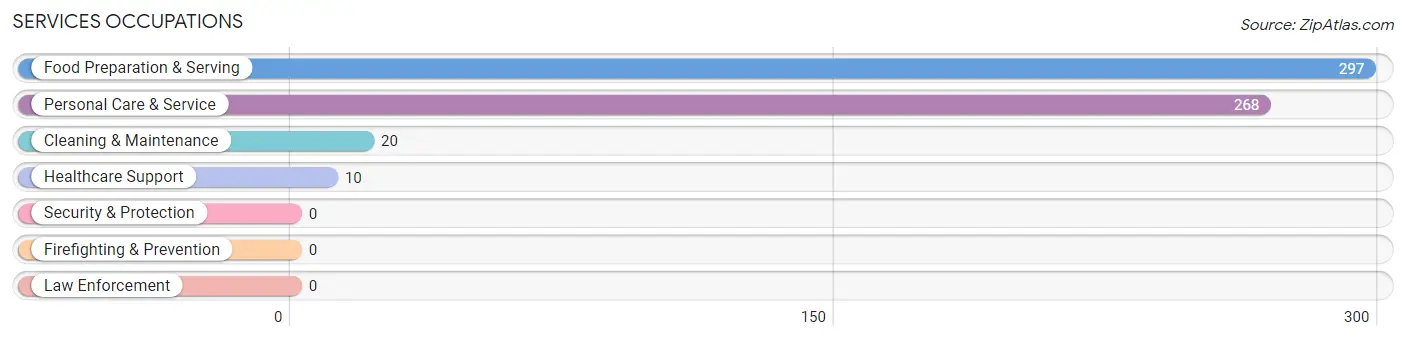
Services Occupations
The most common Services occupations in Zip Code 80310 are Food Preparation & Serving (297 | 14.3%), Personal Care & Service (268 | 12.9%), Cleaning & Maintenance (20 | 1.0%), and Healthcare Support (10 | 0.5%).
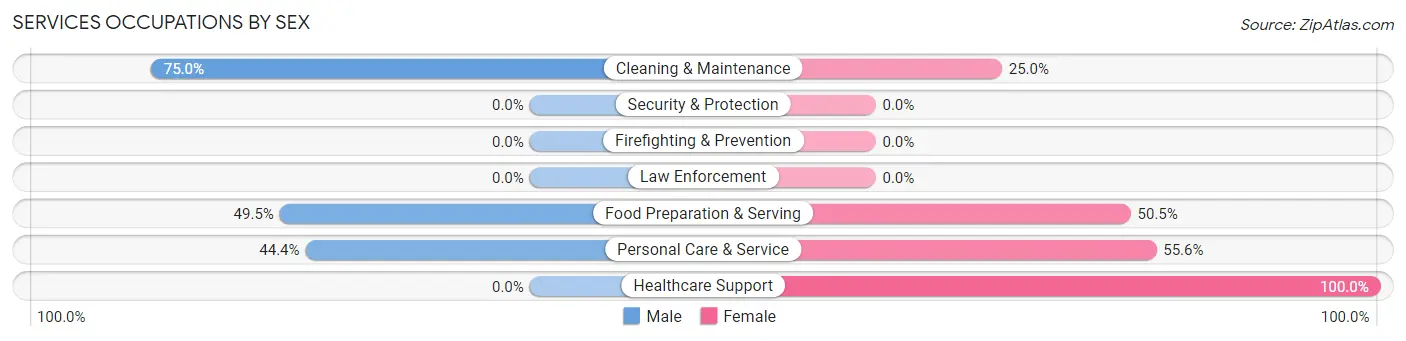
Services Occupations by Sex
Within the Services occupations in Zip Code 80310, the most male-oriented occupations are Cleaning & Maintenance (75.0%), Food Preparation & Serving (49.5%), and Personal Care & Service (44.4%), while the most female-oriented occupations are Healthcare Support (100.0%), Personal Care & Service (55.6%), and Food Preparation & Serving (50.5%).
Occupation
Male
Female
Healthcare Support
0 (0.0%)
10 (100.0%)
Security & Protection
0 (0.0%)
0 (0.0%)
Firefighting & Prevention
0 (0.0%)
0 (0.0%)
Law Enforcement
0 (0.0%)
0 (0.0%)
Food Preparation & Serving
147 (49.5%)
150 (50.5%)
Cleaning & Maintenance
15 (75.0%)
5 (25.0%)
Personal Care & Service
119 (44.4%)
149 (55.6%)
Total (Category)
281 (47.2%)
314 (52.8%)
Total (Overall)
835 (40.3%)
1,239 (59.7%)
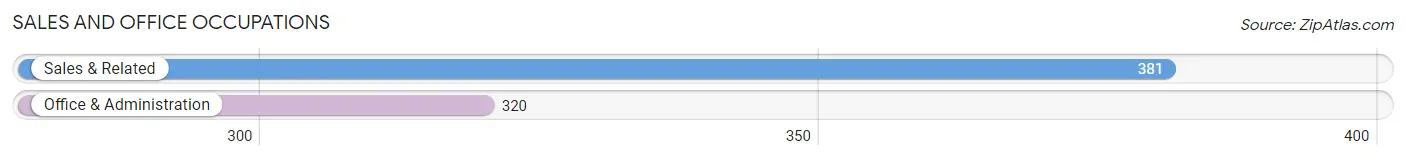
Sales and Office Occupations
The most common Sales and Office occupations in Zip Code 80310 are Sales & Related (381 | 18.4%), and Office & Administration (320 | 15.4%).
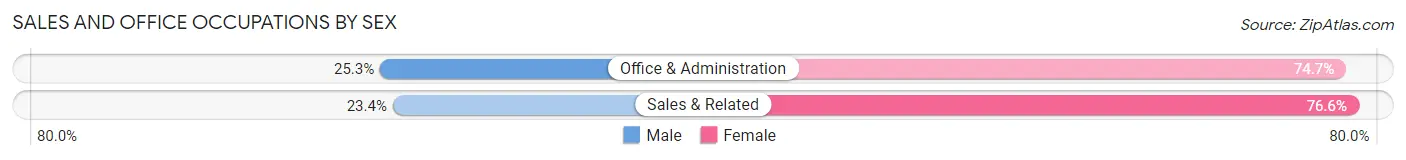
Sales and Office Occupations by Sex
Occupation
Male
Female
Sales & Related
89 (23.4%)
292 (76.6%)
Office & Administration
81 (25.3%)
239 (74.7%)
Total (Category)
170 (24.2%)
531 (75.7%)
Total (Overall)
835 (40.3%)
1,239 (59.7%)
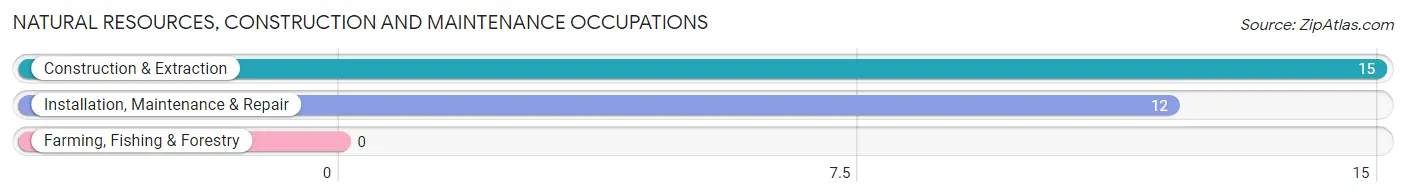
Natural Resources, Construction and Maintenance Occupations
The most common Natural Resources, Construction and Maintenance occupations in Zip Code 80310 are Construction & Extraction (15 | 0.7%), and Installation, Maintenance & Repair (12 | 0.6%).
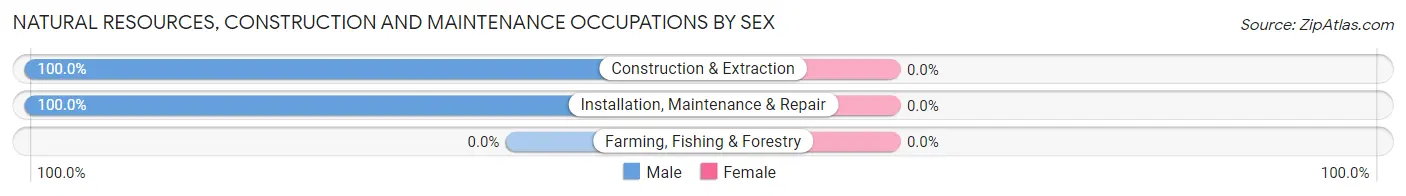
Natural Resources, Construction and Maintenance Occupations by Sex
Occupation
Male
Female
Farming, Fishing & Forestry
0 (0.0%)
0 (0.0%)
Construction & Extraction
15 (100.0%)
0 (0.0%)
Installation, Maintenance & Repair
12 (100.0%)
0 (0.0%)
Total (Category)
27 (100.0%)
0 (0.0%)
Total (Overall)
835 (40.3%)
1,239 (59.7%)
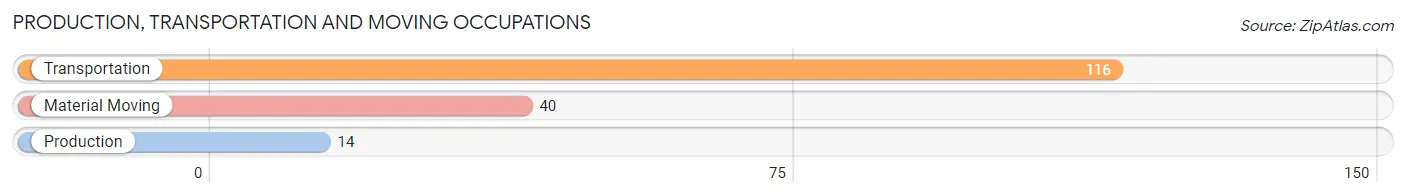
Production, Transportation and Moving Occupations
The most common Production, Transportation and Moving occupations in Zip Code 80310 are Transportation (116 | 5.6%), Material Moving (40 | 1.9%), and Production (14 | 0.7%).
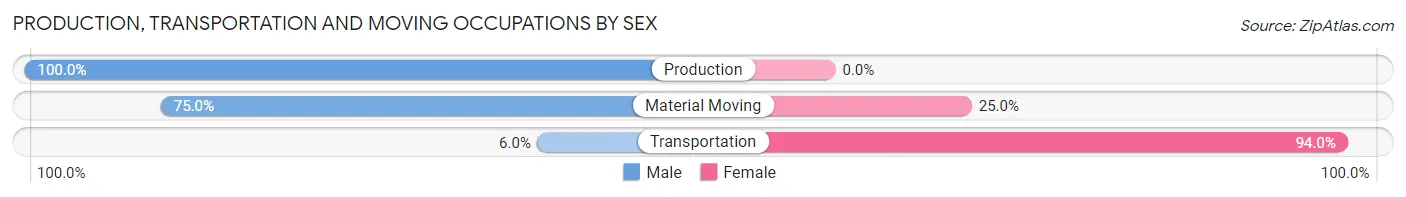
Production, Transportation and Moving Occupations by Sex
Occupation
Male
Female
Production
14 (100.0%)
0 (0.0%)
Transportation
7 (6.0%)
109 (94.0%)
Material Moving
30 (75.0%)
10 (25.0%)
Total (Category)
51 (30.0%)
119 (70.0%)
Total (Overall)
835 (40.3%)
1,239 (59.7%)
Employment Industries by Sex in Zip Code 80310
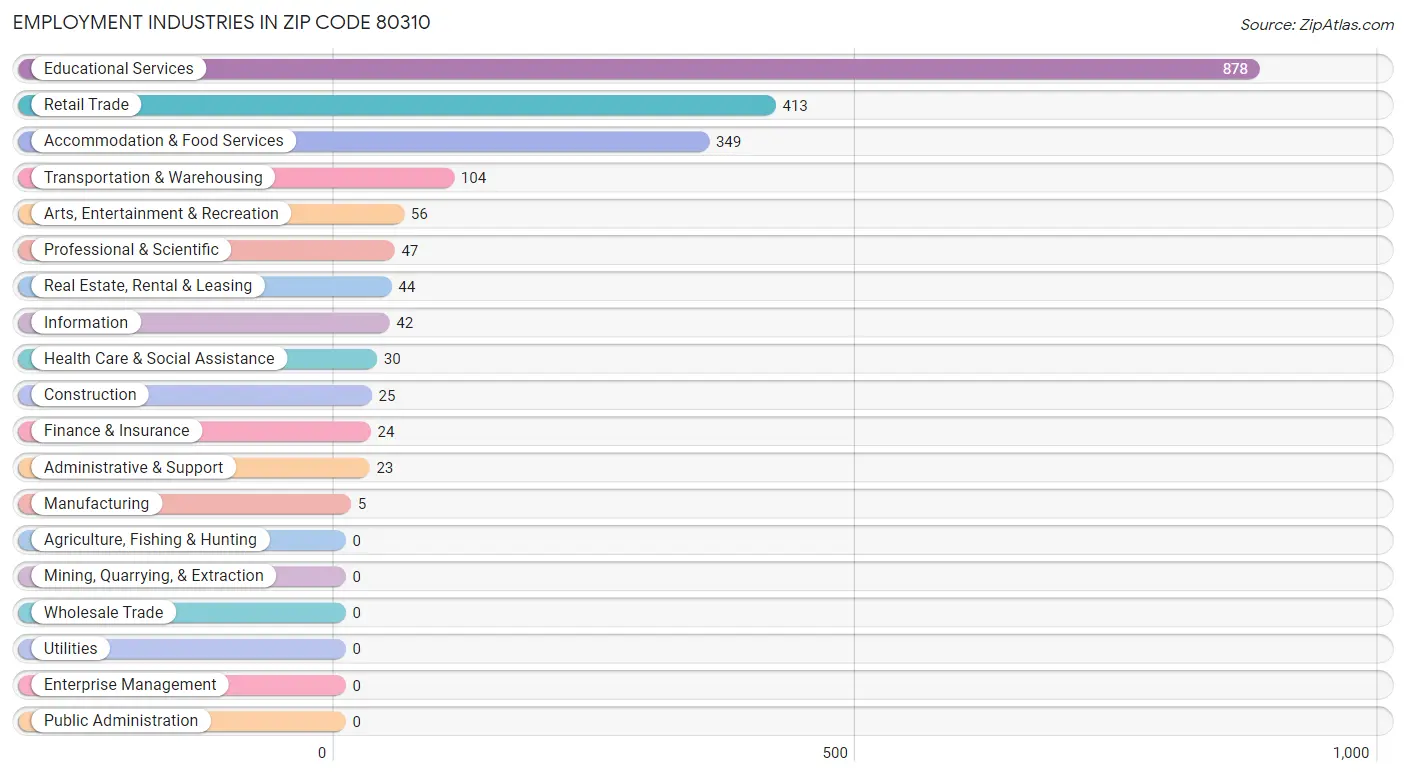
Employment Industries in Zip Code 80310
The major employment industries in Zip Code 80310 include Educational Services (878 | 42.3%), Retail Trade (413 | 19.9%), Accommodation & Food Services (349 | 16.8%), Transportation & Warehousing (104 | 5.0%), and Arts, Entertainment & Recreation (56 | 2.7%).
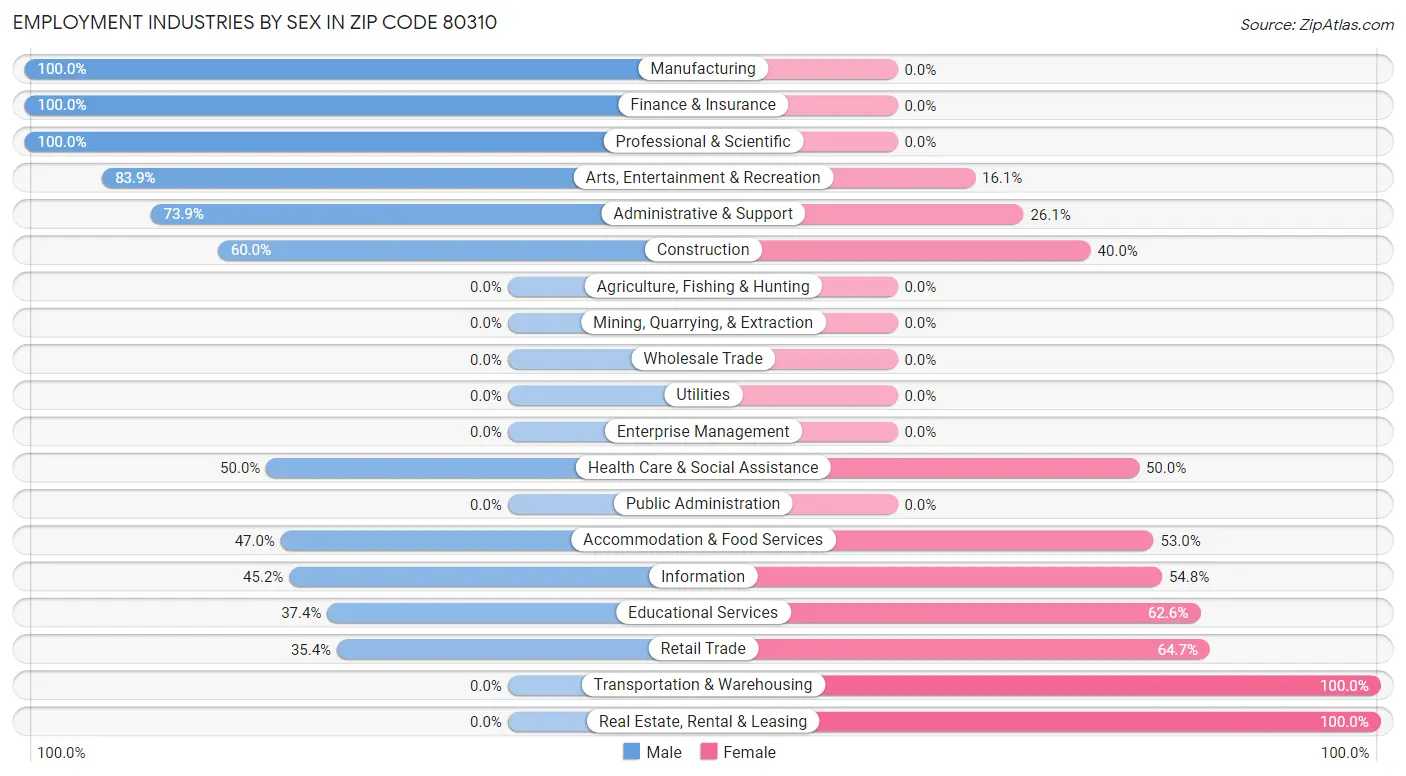
Employment Industries by Sex in Zip Code 80310
The Zip Code 80310 industries that see more men than women are Manufacturing (100.0%), Finance & Insurance (100.0%), and Professional & Scientific (100.0%), whereas the industries that tend to have a higher number of women are Transportation & Warehousing (100.0%), Real Estate, Rental & Leasing (100.0%), and Retail Trade (64.6%).
Industry
Male
Female
Agriculture, Fishing & Hunting
0 (0.0%)
0 (0.0%)
Mining, Quarrying, & Extraction
0 (0.0%)
0 (0.0%)
Construction
15 (60.0%)
10 (40.0%)
Manufacturing
5 (100.0%)
0 (0.0%)
Wholesale Trade
0 (0.0%)
0 (0.0%)
Retail Trade
146 (35.3%)
267 (64.6%)
Transportation & Warehousing
0 (0.0%)
104 (100.0%)
Utilities
0 (0.0%)
0 (0.0%)
Information
19 (45.2%)
23 (54.8%)
Finance & Insurance
24 (100.0%)
0 (0.0%)
Real Estate, Rental & Leasing
0 (0.0%)
44 (100.0%)
Professional & Scientific
47 (100.0%)
0 (0.0%)
Enterprise Management
0 (0.0%)
0 (0.0%)
Administrative & Support
17 (73.9%)
6 (26.1%)
Educational Services
328 (37.4%)
550 (62.6%)
Health Care & Social Assistance
15 (50.0%)
15 (50.0%)
Arts, Entertainment & Recreation
47 (83.9%)
9 (16.1%)
Accommodation & Food Services
164 (47.0%)
185 (53.0%)
Public Administration
0 (0.0%)
0 (0.0%)
Total
835 (40.3%)
1,239 (59.7%)
Education in Zip Code 80310
School Enrollment in Zip Code 80310
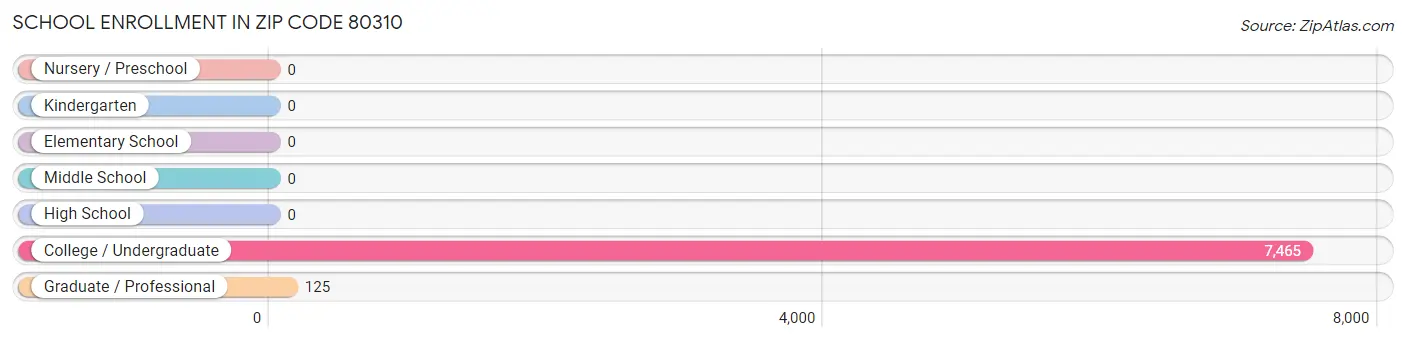
The most common levels of schooling among the 7,590 students in Zip Code 80310 are college / undergraduate (7,465 | 98.4%), and graduate / professional (125 | 1.7%).
School Level
# Students
% Students
Nursery / Preschool
0
0.0%
Kindergarten
0
0.0%
Elementary School
0
0.0%
Middle School
0
0.0%
High School
0
0.0%
College / Undergraduate
7,465
98.4%
Graduate / Professional
125
1.7%
Total
7,590
100.0%
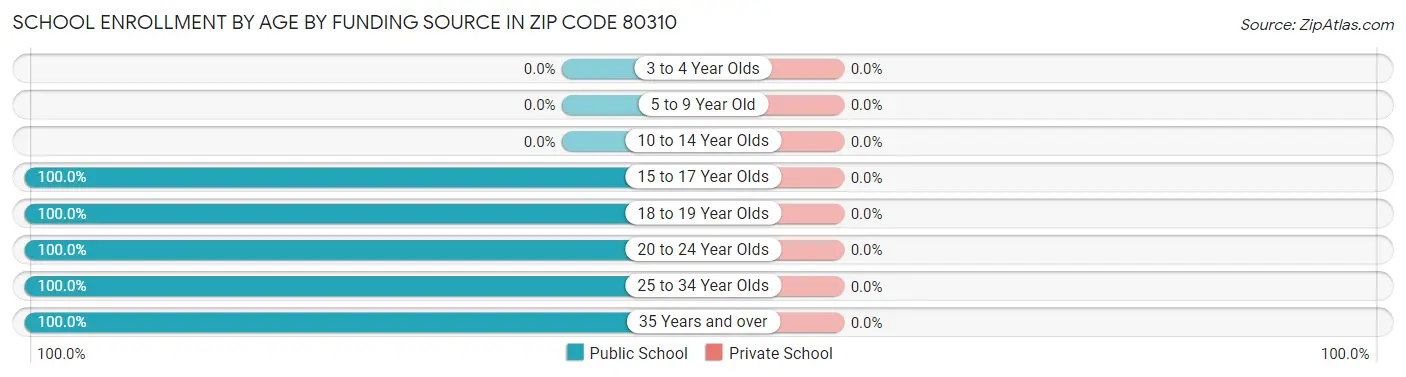
School Enrollment by Age by Funding Source in Zip Code 80310
Age Bracket
Public School
Private School
3 to 4 Year Olds
0 (0.0%)
0 (0.0%)
5 to 9 Year Old
0 (0.0%)
0 (0.0%)
10 to 14 Year Olds
0 (0.0%)
0 (0.0%)
15 to 17 Year Olds
60 (100.0%)
0 (0.0%)
18 to 19 Year Olds
5,411 (100.0%)
0 (0.0%)
20 to 24 Year Olds
2,075 (100.0%)
0 (0.0%)
25 to 34 Year Olds
40 (100.0%)
0 (0.0%)
35 Years and over
4 (100.0%)
0 (0.0%)
Total
7,590 (100.0%)
0 (0.0%)
Educational Attainment by Field of Study in Zip Code 80310
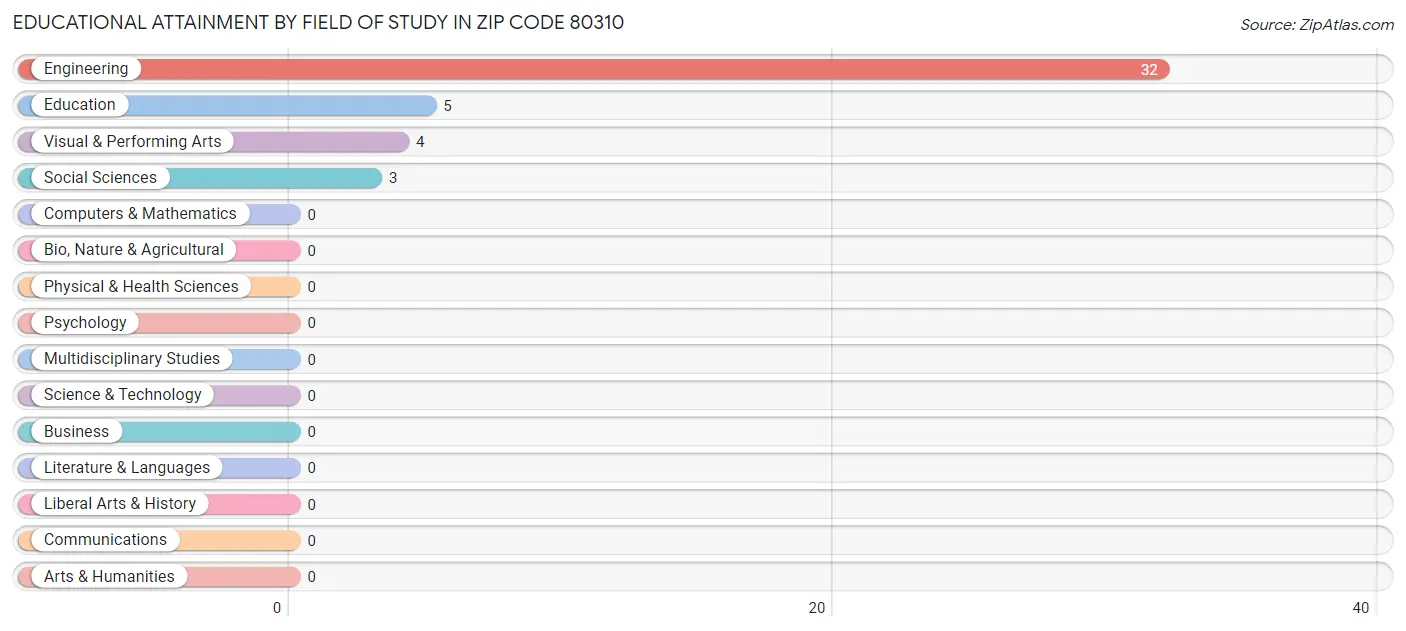
Engineering (32 | 72.7%), education (5 | 11.4%), visual & performing arts (4 | 9.1%), and social sciences (3 | 6.8%) are the most common fields of study among 44 individuals in Zip Code 80310 who have obtained a bachelor's degree or higher.
Field of Study
# Graduates
% Graduates
Computers & Mathematics
0
0.0%
Bio, Nature & Agricultural
0
0.0%
Physical & Health Sciences
0
0.0%
Psychology
0
0.0%
Social Sciences
3
6.8%
Engineering
32
72.7%
Multidisciplinary Studies
0
0.0%
Science & Technology
0
0.0%
Business
0
0.0%
Education
5
11.4%
Literature & Languages
0
0.0%
Liberal Arts & History
0
0.0%
Visual & Performing Arts
4
9.1%
Communications
0
0.0%
Arts & Humanities
0
0.0%
Total
44
100.0%
Transportation & Commute in Zip Code 80310
Vehicle Availability by Sex in Zip Code 80310
Vehicles Available
Male
Female
No Vehicle
0 (0.0%)
0 (0.0%)
1 Vehicle
0 (0.0%)
0 (0.0%)
2 Vehicles
0 (0.0%)
0 (0.0%)
3 Vehicles
0 (0.0%)
0 (0.0%)
4 Vehicles
0 (0.0%)
0 (0.0%)
5 or more Vehicles
0 (0.0%)
0 (0.0%)
Total
0 (0.0%)
0 (0.0%)
Commute Time in Zip Code 80310
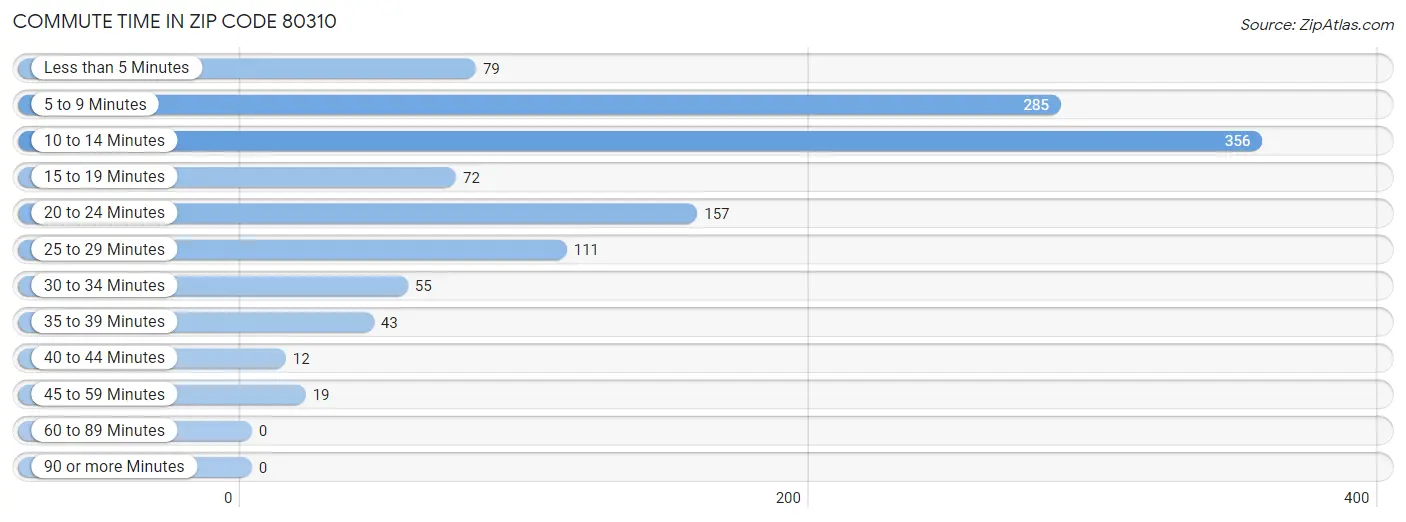
The most frequently occuring commute durations in Zip Code 80310 are 10 to 14 minutes (356 commuters, 29.9%), 5 to 9 minutes (285 commuters, 24.0%), and 20 to 24 minutes (157 commuters, 13.2%).
Commute Time
# Commuters
% Commuters
Less than 5 Minutes
79
6.6%
5 to 9 Minutes
285
24.0%
10 to 14 Minutes
356
29.9%
15 to 19 Minutes
72
6.1%
20 to 24 Minutes
157
13.2%
25 to 29 Minutes
111
9.3%
30 to 34 Minutes
55
4.6%
35 to 39 Minutes
43
3.6%
40 to 44 Minutes
12
1.0%
45 to 59 Minutes
19
1.6%
60 to 89 Minutes
0
0.0%
90 or more Minutes
0
0.0%
Commute Time by Sex in Zip Code 80310
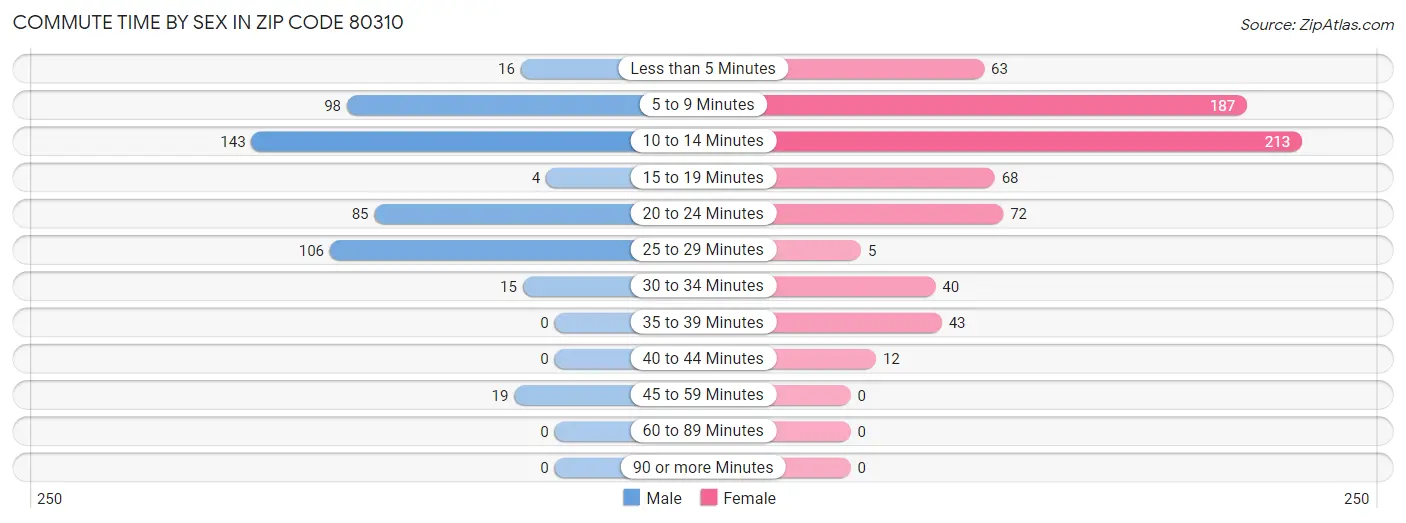
The most common commute times in Zip Code 80310 are 10 to 14 minutes (143 commuters, 29.4%) for males and 10 to 14 minutes (213 commuters, 30.3%) for females.
Commute Time
Male
Female
Less than 5 Minutes
16 (3.3%)
63 (9.0%)
5 to 9 Minutes
98 (20.2%)
187 (26.6%)
10 to 14 Minutes
143 (29.4%)
213 (30.3%)
15 to 19 Minutes
4 (0.8%)
68 (9.7%)
20 to 24 Minutes
85 (17.5%)
72 (10.2%)
25 to 29 Minutes
106 (21.8%)
5 (0.7%)
30 to 34 Minutes
15 (3.1%)
40 (5.7%)
35 to 39 Minutes
0 (0.0%)
43 (6.1%)
40 to 44 Minutes
0 (0.0%)
12 (1.7%)
45 to 59 Minutes
19 (3.9%)
0 (0.0%)
60 to 89 Minutes
0 (0.0%)
0 (0.0%)
90 or more Minutes
0 (0.0%)
0 (0.0%)
Time of Departure to Work by Sex in Zip Code 80310
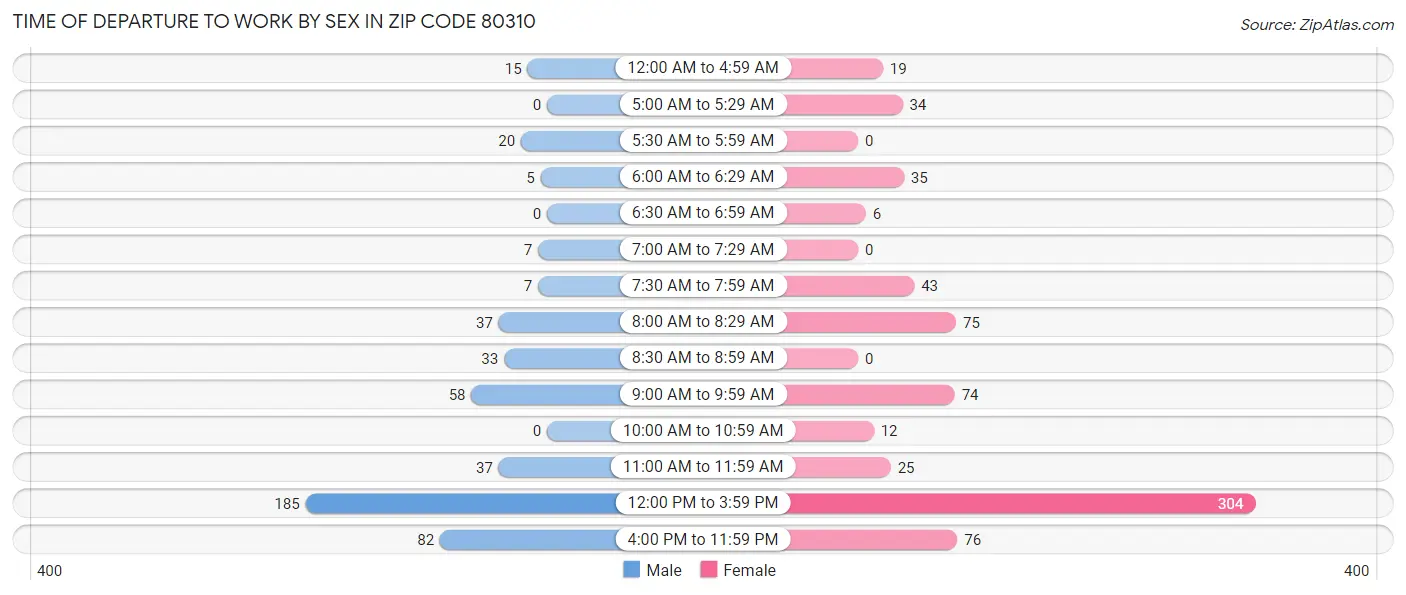
The most frequent times of departure to work in Zip Code 80310 are 12:00 PM to 3:59 PM (185, 38.1%) for males and 12:00 PM to 3:59 PM (304, 43.2%) for females.
Time of Departure
Male
Female
12:00 AM to 4:59 AM
15 (3.1%)
19 (2.7%)
5:00 AM to 5:29 AM
0 (0.0%)
34 (4.8%)
5:30 AM to 5:59 AM
20 (4.1%)
0 (0.0%)
6:00 AM to 6:29 AM
5 (1.0%)
35 (5.0%)
6:30 AM to 6:59 AM
0 (0.0%)
6 (0.9%)
7:00 AM to 7:29 AM
7 (1.4%)
0 (0.0%)
7:30 AM to 7:59 AM
7 (1.4%)
43 (6.1%)
8:00 AM to 8:29 AM
37 (7.6%)
75 (10.7%)
8:30 AM to 8:59 AM
33 (6.8%)
0 (0.0%)
9:00 AM to 9:59 AM
58 (11.9%)
74 (10.5%)
10:00 AM to 10:59 AM
0 (0.0%)
12 (1.7%)
11:00 AM to 11:59 AM
37 (7.6%)
25 (3.6%)
12:00 PM to 3:59 PM
185 (38.1%)
304 (43.2%)
4:00 PM to 11:59 PM
82 (16.9%)
76 (10.8%)
Total
486 (100.0%)
703 (100.0%)
Housing Occupancy in Zip Code 80310
Occupancy by Ownership in Zip Code 80310
Occupancy
# Housing Units
% Housing Units
Owner Occupied Housing Units
0
0.0%
Renter-Occupied Housing Units
0
0.0%
Total Occupied Housing Units
0
0.0%
Occupancy by Household Size in Zip Code 80310
Household Size
# Housing Units
% Housing Units
1-Person Household
0
0.0%
2-Person Household
0
0.0%
3-Person Household
0
0.0%
4+ Person Household
0
0.0%
Total Housing Units
0
0.0%
Occupancy by Ownership by Household Size in Zip Code 80310
Household Size
Owner-occupied
Renter-occupied
1-Person Household
0 (0.0%)
0 (0.0%)
2-Person Household
0 (0.0%)
0 (0.0%)
3-Person Household
0 (0.0%)
0 (0.0%)
4+ Person Household
0 (0.0%)
0 (0.0%)
Total Housing Units
0 (0.0%)
0 (0.0%)
Occupancy by Educational Attainment in Zip Code 80310
Household Size
Owner-occupied
Renter-occupied
Less than High School
0 (0.0%)
0 (0.0%)
High School Diploma
0 (0.0%)
0 (0.0%)
College/Associate Degree
0 (0.0%)
0 (0.0%)
Bachelor's Degree or higher
0 (0.0%)
0 (0.0%)
Occupancy by Age of Householder in Zip Code 80310
Age Bracket
# Households
% Households
Under 35 Years
0
0.0%
35 to 44 Years
0
0.0%
45 to 54 Years
0
0.0%
55 to 64 Years
0
0.0%
65 to 74 Years
0
0.0%
75 to 84 Years
0
0.0%
85 Years and Over
0
0.0%
Total
0
0.0%
Housing Finances in Zip Code 80310
Median Income by Occupancy in Zip Code 80310
Occupancy Type
# Households
Median Income
Owner-Occupied
0 (0.0%)
$0
Renter-Occupied
0 (0.0%)
$0
Average
0 (0.0%)
$0
Occupancy by Householder Income Bracket in Zip Code 80310
Income Bracket
Owner-occupied
Renter-occupied
Less than $5,000
0 (0.0%)
0 (0.0%)
$5,000 to $9,999
0 (0.0%)
0 (0.0%)
$10,000 to $14,999
0 (0.0%)
0 (0.0%)
$15,000 to $19,999
0 (0.0%)
0 (0.0%)
$20,000 to $24,999
0 (0.0%)
0 (0.0%)
$25,000 to $34,999
0 (0.0%)
0 (0.0%)
$35,000 to $49,999
0 (0.0%)
0 (0.0%)
$50,000 to $74,999
0 (0.0%)
0 (0.0%)
$75,000 to $99,999
0 (0.0%)
0 (0.0%)
$100,000 to $149,999
0 (0.0%)
0 (0.0%)
$150,000 or more
0 (0.0%)
0 (0.0%)
Total
0 (0.0%)
0 (0.0%)
Monthly Housing Cost Tiers in Zip Code 80310
Monthly Cost
Owner-occupied
Renter-occupied
Less than $300
0 (0.0%)
0 (0.0%)
$300 to $499
0 (0.0%)
0 (0.0%)
$500 to $799
0 (0.0%)
0 (0.0%)
$800 to $999
0 (0.0%)
0 (0.0%)
$1,000 to $1,499
0 (0.0%)
0 (0.0%)
$1,500 to $1,999
0 (0.0%)
0 (0.0%)
$2,000 to $2,499
0 (0.0%)
0 (0.0%)
$2,500 to $2,999
0 (0.0%)
0 (0.0%)
$3,000 or more
0 (0.0%)
0 (0.0%)
Total
0 (0.0%)
0 (0.0%)
Physical Housing Characteristics in Zip Code 80310
Housing Structures in Zip Code 80310
Structure Type
# Housing Units
% Housing Units
Single Unit, Detached
0
0.0%
Single Unit, Attached
0
0.0%
2 Unit Apartments
0
0.0%
3 or 4 Unit Apartments
0
0.0%
5 to 9 Unit Apartments
0
0.0%
10 or more Apartments
0
0.0%
Mobile Home / Other
0
0.0%
Total
0
0.0%
Housing Structures by Occupancy in Zip Code 80310
Structure Type
Owner-occupied
Renter-occupied
Single Unit, Detached
0 (0.0%)
0 (0.0%)
Single Unit, Attached
0 (0.0%)
0 (0.0%)
2 Unit Apartments
0 (0.0%)
0 (0.0%)
3 or 4 Unit Apartments
0 (0.0%)
0 (0.0%)
5 to 9 Unit Apartments
0 (0.0%)
0 (0.0%)
10 or more Apartments
0 (0.0%)
0 (0.0%)
Mobile Home / Other
0 (0.0%)
0 (0.0%)
Total
0 (0.0%)
0 (0.0%)
Housing Structures by Number of Rooms in Zip Code 80310
Number of Rooms
Owner-occupied
Renter-occupied
1 Room
0 (0.0%)
0 (0.0%)
2 or 3 Rooms
0 (0.0%)
0 (0.0%)
4 or 5 Rooms
0 (0.0%)
0 (0.0%)
6 or 7 Rooms
0 (0.0%)
0 (0.0%)
8 or more Rooms
0 (0.0%)
0 (0.0%)
Total
0 (0.0%)
0 (0.0%)
Housing Structure by Heating Type in Zip Code 80310
Heating Type
Owner-occupied
Renter-occupied
Utility Gas
0 (0.0%)
0 (0.0%)
Bottled, Tank, or LP Gas
0 (0.0%)
0 (0.0%)
Electricity
0 (0.0%)
0 (0.0%)
Fuel Oil or Kerosene
0 (0.0%)
0 (0.0%)
Coal or Coke
0 (0.0%)
0 (0.0%)
All other Fuels
0 (0.0%)
0 (0.0%)
No Fuel Used
0 (0.0%)
0 (0.0%)
Total
0 (0.0%)
0 (0.0%)
Household Vehicle Usage in Zip Code 80310
Vehicles per Household
Owner-occupied
Renter-occupied
No Vehicle
0 (0.0%)
0 (0.0%)
1 Vehicle
0 (0.0%)
0 (0.0%)
2 Vehicles
0 (0.0%)
0 (0.0%)
3 or more Vehicles
0 (0.0%)
0 (0.0%)
Total
0 (0.0%)
0 (0.0%)
Real Estate & Mortgages in Zip Code 80310
Real Estate and Mortgage Overview in Zip Code 80310
Characteristic
Without Mortgage
With Mortgage
Housing Units
0
0
Median Property Value
-
-
Median Household Income
-
-
Monthly Housing Costs
-
-
Real Estate Taxes
-
-
Property Value by Mortgage Status in Zip Code 80310
Property Value
Without Mortgage
With Mortgage
Less than $50,000
0 (0.0%)
0 (0.0%)
$50,000 to $99,999
0 (0.0%)
0 (0.0%)
$100,000 to $299,999
0 (0.0%)
0 (0.0%)
$300,000 to $499,999
0 (0.0%)
0 (0.0%)
$500,000 to $749,999
0 (0.0%)
0 (0.0%)
$750,000 to $999,999
0 (0.0%)
0 (0.0%)
$1,000,000 or more
0 (0.0%)
0 (0.0%)
Total
0 (0.0%)
0 (0.0%)
Household Income by Mortgage Status in Zip Code 80310
Household Income
Without Mortgage
With Mortgage
Less than $10,000
0 (0.0%)
0 (0.0%)
$10,000 to $24,999
0 (0.0%)
0 (0.0%)
$25,000 to $34,999
0 (0.0%)
0 (0.0%)
$35,000 to $49,999
0 (0.0%)
0 (0.0%)
$50,000 to $74,999
0 (0.0%)
0 (0.0%)
$75,000 to $99,999
0 (0.0%)
0 (0.0%)
$100,000 to $149,999
0 (0.0%)
0 (0.0%)
$150,000 or more
0 (0.0%)
0 (0.0%)
Total
0 (0.0%)
0 (0.0%)
Property Value to Household Income Ratio in Zip Code 80310
Value-to-Income Ratio
Without Mortgage
With Mortgage
Less than 2.0x
0 (0.0%)
0 (0.0%)
2.0x to 2.9x
0 (0.0%)
0 (0.0%)
3.0x to 3.9x
0 (0.0%)
0 (0.0%)
4.0x or more
0 (0.0%)
0 (0.0%)
Total
0 (0.0%)
0 (0.0%)
Real Estate Taxes by Mortgage Status in Zip Code 80310
Property Taxes
Without Mortgage
With Mortgage
Less than $800
0 (0.0%)
0 (0.0%)
$800 to $1,499
0 (0.0%)
0 (0.0%)
$800 to $1,499
0 (0.0%)
0 (0.0%)
Total
0 (0.0%)
0 (0.0%)
Health & Disability in Zip Code 80310
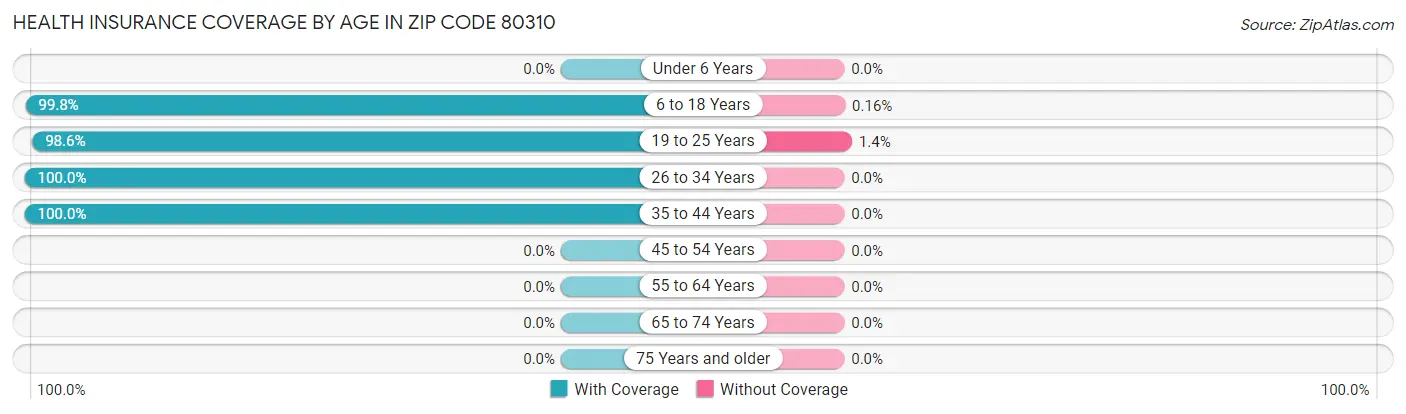
Health Insurance Coverage by Age in Zip Code 80310
Age Bracket
With Coverage
Without Coverage
Under 6 Years
0 (0.0%)
0 (0.0%)
6 to 18 Years
3,089 (99.8%)
5 (0.2%)
19 to 25 Years
4,401 (98.6%)
64 (1.4%)
26 to 34 Years
34 (100.0%)
0 (0.0%)
35 to 44 Years
4 (100.0%)
0 (0.0%)
45 to 54 Years
0 (0.0%)
0 (0.0%)
55 to 64 Years
0 (0.0%)
0 (0.0%)
65 to 74 Years
0 (0.0%)
0 (0.0%)
75 Years and older
0 (0.0%)
0 (0.0%)
Total
7,528 (99.1%)
69 (0.9%)
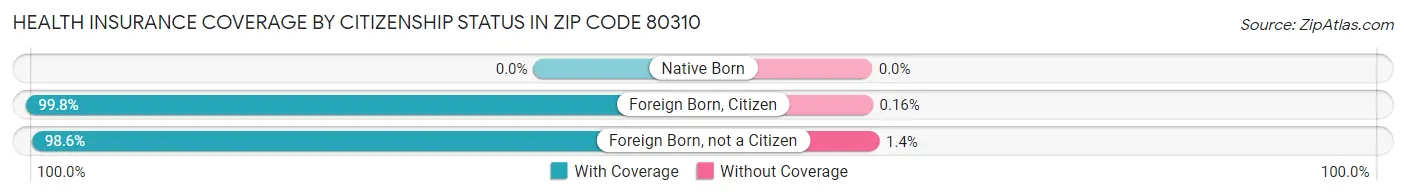
Health Insurance Coverage by Citizenship Status in Zip Code 80310
Citizenship Status
With Coverage
Without Coverage
Native Born
0 (0.0%)
0 (0.0%)
Foreign Born, Citizen
3,089 (99.8%)
5 (0.2%)
Foreign Born, not a Citizen
4,401 (98.6%)
64 (1.4%)
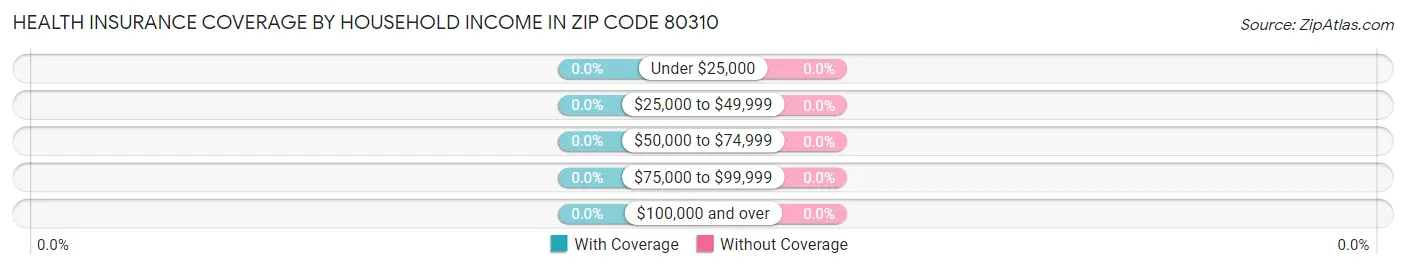
Health Insurance Coverage by Household Income in Zip Code 80310
Household Income
With Coverage
Without Coverage
Under $25,000
0 (0.0%)
0 (0.0%)
$25,000 to $49,999
0 (0.0%)
0 (0.0%)
$50,000 to $74,999
0 (0.0%)
0 (0.0%)
$75,000 to $99,999
0 (0.0%)
0 (0.0%)
$100,000 and over
0 (0.0%)
0 (0.0%)
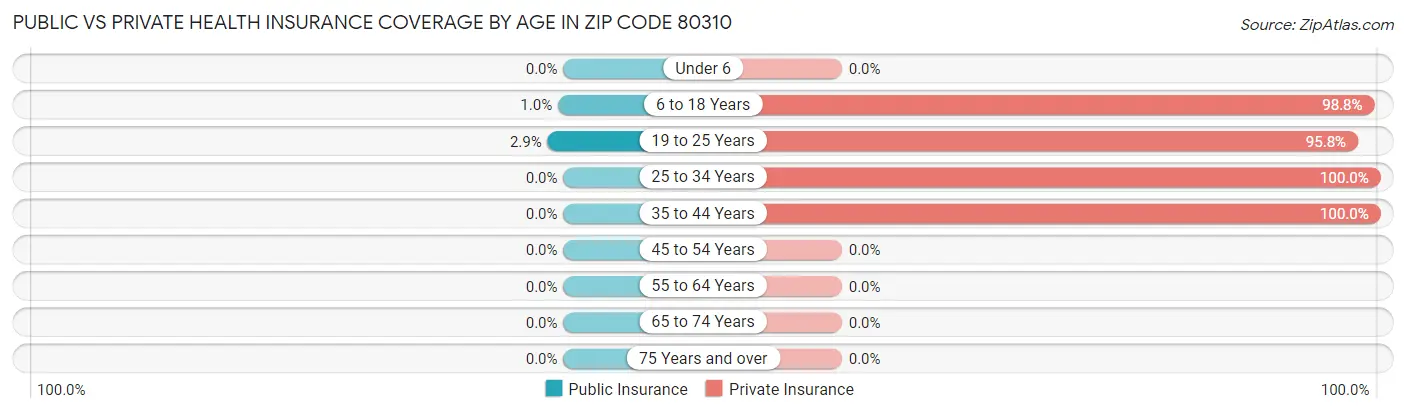
Public vs Private Health Insurance Coverage by Age in Zip Code 80310
Age Bracket
Public Insurance
Private Insurance
Under 6
0 (0.0%)
0 (0.0%)
6 to 18 Years
31 (1.0%)
3,058 (98.8%)
19 to 25 Years
131 (2.9%)
4,277 (95.8%)
25 to 34 Years
0 (0.0%)
34 (100.0%)
35 to 44 Years
0 (0.0%)
4 (100.0%)
45 to 54 Years
0 (0.0%)
0 (0.0%)
55 to 64 Years
0 (0.0%)
0 (0.0%)
65 to 74 Years
0 (0.0%)
0 (0.0%)
75 Years and over
0 (0.0%)
0 (0.0%)
Total
162 (2.1%)
7,373 (97.1%)
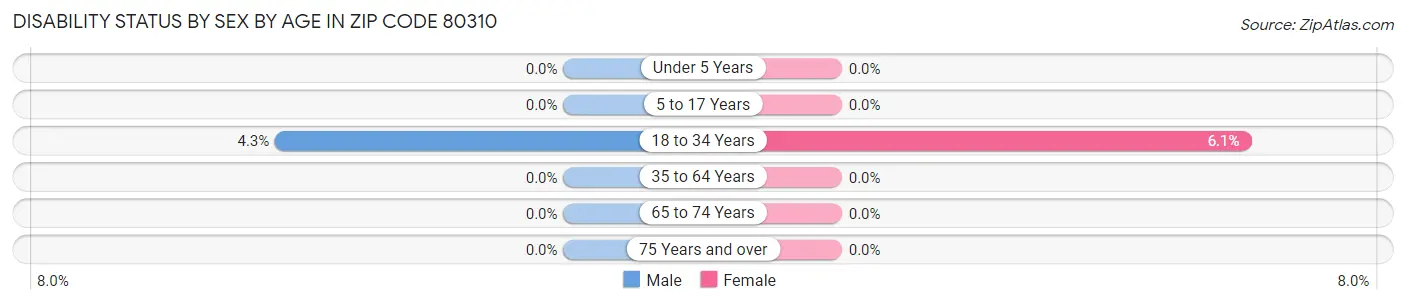
Disability Status by Sex by Age in Zip Code 80310
Age Bracket
Male
Female
Under 5 Years
0 (0.0%)
0 (0.0%)
5 to 17 Years
0 (0.0%)
0 (0.0%)
18 to 34 Years
166 (4.3%)
222 (6.1%)
35 to 64 Years
0 (0.0%)
0 (0.0%)
65 to 74 Years
0 (0.0%)
0 (0.0%)
75 Years and over
0 (0.0%)
0 (0.0%)
Disability Class by Sex by Age in Zip Code 80310
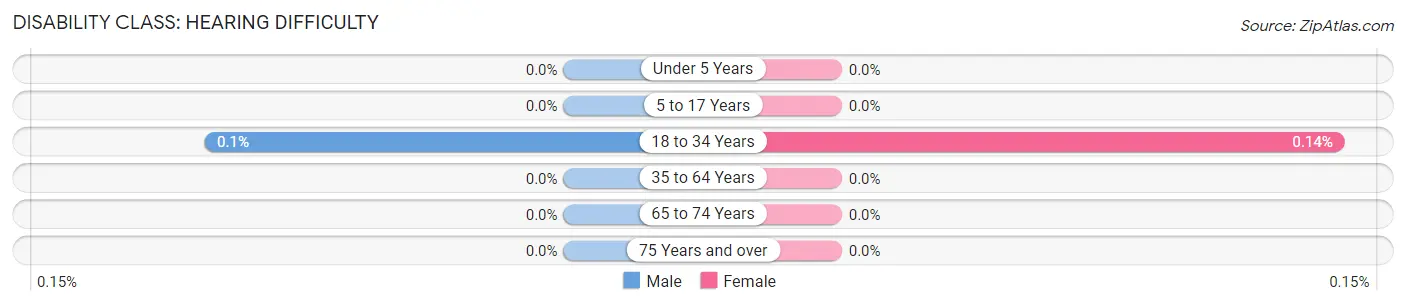
Disability Class: Hearing Difficulty
Age Bracket
Male
Female
Under 5 Years
0 (0.0%)
0 (0.0%)
5 to 17 Years
0 (0.0%)
0 (0.0%)
18 to 34 Years
4 (0.1%)
5 (0.1%)
35 to 64 Years
0 (0.0%)
0 (0.0%)
65 to 74 Years
0 (0.0%)
0 (0.0%)
75 Years and over
0 (0.0%)
0 (0.0%)
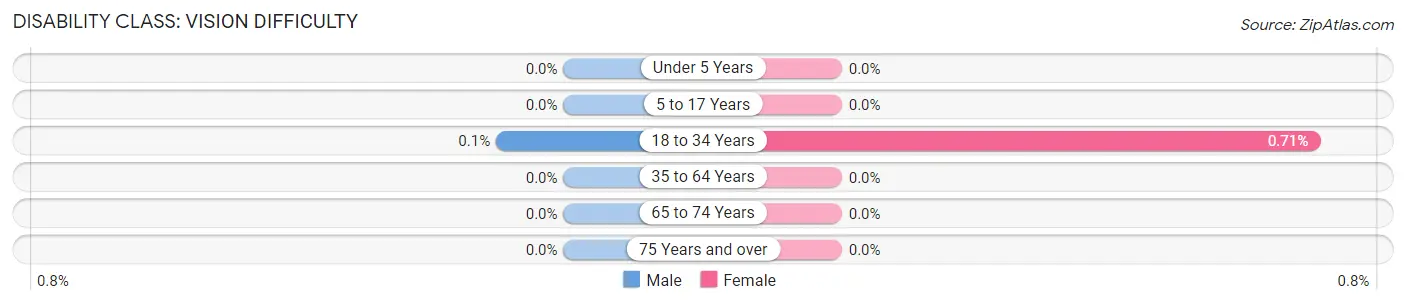
Disability Class: Vision Difficulty
Age Bracket
Male
Female
Under 5 Years
0 (0.0%)
0 (0.0%)
5 to 17 Years
0 (0.0%)
0 (0.0%)
18 to 34 Years
4 (0.1%)
26 (0.7%)
35 to 64 Years
0 (0.0%)
0 (0.0%)
65 to 74 Years
0 (0.0%)
0 (0.0%)
75 Years and over
0 (0.0%)
0 (0.0%)
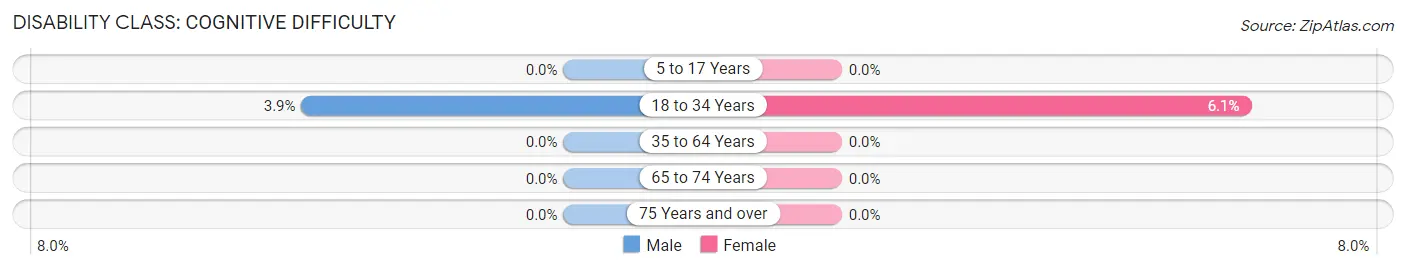
Disability Class: Cognitive Difficulty
Age Bracket
Male
Female
5 to 17 Years
0 (0.0%)
0 (0.0%)
18 to 34 Years
151 (3.9%)
222 (6.1%)
35 to 64 Years
0 (0.0%)
0 (0.0%)
65 to 74 Years
0 (0.0%)
0 (0.0%)
75 Years and over
0 (0.0%)
0 (0.0%)
Disability Class: Ambulatory Difficulty
Age Bracket
Male
Female
5 to 17 Years
0 (0.0%)
0 (0.0%)
18 to 34 Years
19 (0.5%)
0 (0.0%)
35 to 64 Years
0 (0.0%)
0 (0.0%)
65 to 74 Years
0 (0.0%)
0 (0.0%)
75 Years and over
0 (0.0%)
0 (0.0%)
Disability Class: Self-Care Difficulty
Age Bracket
Male
Female
5 to 17 Years
0 (0.0%)
0 (0.0%)
18 to 34 Years
4 (0.1%)
0 (0.0%)
35 to 64 Years
0 (0.0%)
0 (0.0%)
65 to 74 Years
0 (0.0%)
0 (0.0%)
75 Years and over
0 (0.0%)
0 (0.0%)
Technology Access in Zip Code 80310
Computing Device Access in Zip Code 80310
Device Type
# Households
% Households
Desktop or Laptop
0
0.0%
Smartphone
0
0.0%
Tablet
0
0.0%
No Computing Device
0
0.0%
Total
0
0.0%
Internet Access in Zip Code 80310
Internet Type
# Households
% Households
Dial-Up Internet
0
0.0%
Broadband Home
0
0.0%
Cellular Data Only
0
0.0%
Satellite Internet
0
0.0%
No Internet
0
0.0%
Total
0
0.0%
Common Questions
What is Per Capita Income in Zip Code 80310?
Per Capita income in Zip Code 80310 is $4,454.
What is Income or Wage Gap in Zip Code 80310?
Income or Wage Gap in Zip Code 80310 is 16.7%.
Women in Zip Code 80310 earn 83.3 cents for every dollar earned by a man.
What is the Total Population of Zip Code 80310?
Total Population of Zip Code 80310 is 7,597.
What is the Total Male Population of Zip Code 80310?
Total Male Population of Zip Code 80310 is 3,904.
What is the Total Female Population of Zip Code 80310?
Total Female Population of Zip Code 80310 is 3,693.
What is the Ratio of Males per 100 Females in Zip Code 80310?
There are 105.71 Males per 100 Females in Zip Code 80310.
What is the Ratio of Females per 100 Males in Zip Code 80310?
There are 94.60 Females per 100 Males in Zip Code 80310.
What is the Median Population Age in Zip Code 80310?
Median Population Age in Zip Code 80310 is 19.3 Years.
How Large is the Labor Force in Zip Code 80310?
There are 2,507 People in the Labor Forcein in Zip Code 80310.
What is the Percentage of People in the Labor Force in Zip Code 80310?
33.0% of People are in the Labor Force in Zip Code 80310.
What is the Unemployment Rate in Zip Code 80310?
Unemployment Rate in Zip Code 80310 is 17.2%.
Report Title
Report Link
HTML Copy & Paste Link
Social Media
Copy and paste the folowing code into any webpage where you would like this interactive chart to display