Zip Codes with the Highest Percentage of Population with a Degree in Engineering in Puerto Rico
RELATED REPORTS & OPTIONS
Engineering
Puerto Rico
Compare Zip Codes
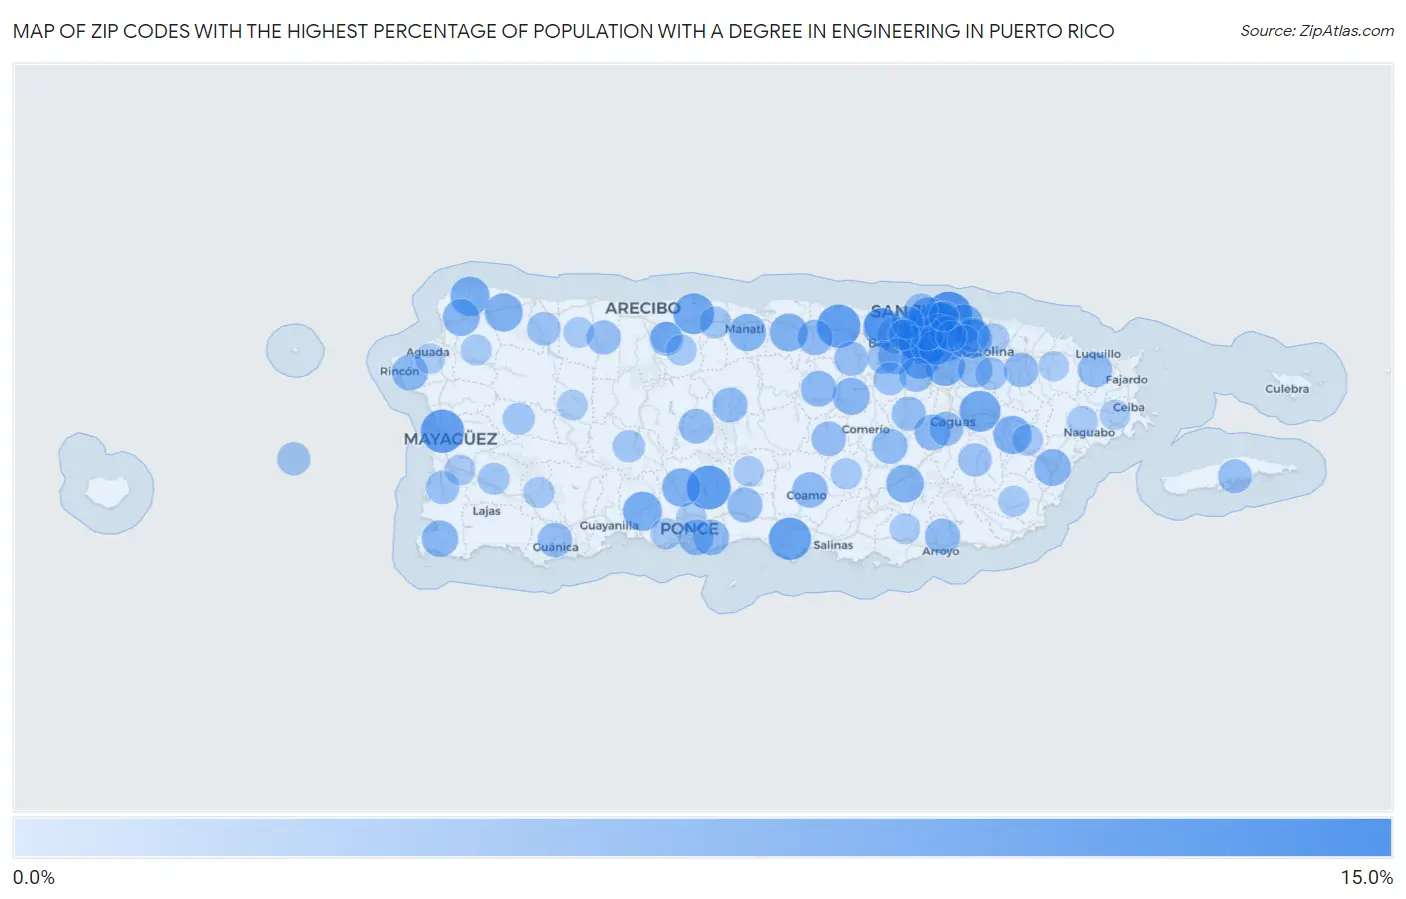
Map of Zip Codes with the Highest Percentage of Population with a Degree in Engineering in Puerto Rico
0.0%
15.0%
Zip Codes with the Highest Percentage of Population with a Degree in Engineering in Puerto Rico
| Zip Code | % Graduates | vs State | vs National | |
| 1. | 00968 | 13.3% | 5.1%(+8.26)#1 | 7.6%(+5.67)#2,297 |
| 2. | 00913 | 11.7% | 5.1%(+6.66)#2 | 7.6%(+4.07)#3,046 |
| 3. | 00780 | 10.1% | 5.1%(+5.09)#3 | 7.6%(+2.49)#4,325 |
| 4. | 00646 | 9.9% | 5.1%(+4.85)#4 | 7.6%(+2.26)#4,527 |
| 5. | 00682 | 9.9% | 5.1%(+4.80)#5 | 7.6%(+2.20)#4,574 |
| 6. | 00757 | 9.3% | 5.1%(+4.25)#6 | 7.6%(+1.66)#5,190 |
| 7. | 00778 | 8.5% | 5.1%(+3.44)#7 | 7.6%(+0.852)#6,282 |
| 8. | 00652 | 8.4% | 5.1%(+3.36)#8 | 7.6%(+0.765)#6,400 |
| 9. | 00965 | 8.4% | 5.1%(+3.33)#9 | 7.6%(+0.738)#6,444 |
| 10. | 00925 | 8.3% | 5.1%(+3.27)#10 | 7.6%(+0.681)#6,550 |
| 11. | 00907 | 8.1% | 5.1%(+3.09)#11 | 7.6%(+0.502)#6,843 |
| 12. | 00969 | 8.0% | 5.1%(+2.93)#12 | 7.6%(+0.343)#7,115 |
| 13. | 00926 | 7.7% | 5.1%(+2.66)#13 | 7.6%(+0.073)#7,594 |
| 14. | 00690 | 7.5% | 5.1%(+2.45)#14 | 7.6%(-0.141)#7,986 |
| 15. | 00624 | 7.5% | 5.1%(+2.42)#15 | 7.6%(-0.172)#8,051 |
| 16. | 00952 | 7.4% | 5.1%(+2.35)#16 | 7.6%(-0.244)#8,200 |
| 17. | 00909 | 7.4% | 5.1%(+2.32)#17 | 7.6%(-0.267)#8,237 |
| 18. | 00979 | 7.3% | 5.1%(+2.29)#18 | 7.6%(-0.305)#8,312 |
| 19. | 00982 | 7.3% | 5.1%(+2.20)#19 | 7.6%(-0.386)#8,459 |
| 20. | 00731 | 7.1% | 5.1%(+2.02)#20 | 7.6%(-0.572)#8,827 |
| 21. | 00777 | 7.0% | 5.1%(+1.93)#21 | 7.6%(-0.659)#9,005 |
| 22. | 00662 | 6.9% | 5.1%(+1.87)#22 | 7.6%(-0.720)#9,161 |
| 23. | 00693 | 6.8% | 5.1%(+1.77)#23 | 7.6%(-0.822)#9,355 |
| 24. | 00736 | 6.8% | 5.1%(+1.74)#24 | 7.6%(-0.854)#9,410 |
| 25. | 00674 | 6.5% | 5.1%(+1.42)#25 | 7.6%(-1.17)#10,048 |
| 26. | 00719 | 6.3% | 5.1%(+1.27)#26 | 7.6%(-1.32)#10,382 |
| 27. | 00603 | 6.3% | 5.1%(+1.24)#27 | 7.6%(-1.35)#10,470 |
| 28. | 00791 | 6.3% | 5.1%(+1.22)#28 | 7.6%(-1.37)#10,518 |
| 29. | 00966 | 6.1% | 5.1%(+1.04)#29 | 7.6%(-1.55)#10,952 |
| 30. | 00622 | 6.0% | 5.1%(+0.965)#30 | 7.6%(-1.63)#11,134 |
| 31. | 00912 | 5.8% | 5.1%(+0.774)#31 | 7.6%(-1.82)#11,613 |
| 32. | 00677 | 5.8% | 5.1%(+0.711)#32 | 7.6%(-1.88)#11,771 |
| 33. | 00961 | 5.7% | 5.1%(+0.690)#33 | 7.6%(-1.90)#11,829 |
| 34. | 00959 | 5.7% | 5.1%(+0.670)#34 | 7.6%(-1.92)#11,876 |
| 35. | 00727 | 5.7% | 5.1%(+0.632)#35 | 7.6%(-1.96)#11,978 |
| 36. | 00921 | 5.6% | 5.1%(+0.581)#36 | 7.6%(-2.01)#12,109 |
| 37. | 00783 | 5.6% | 5.1%(+0.548)#37 | 7.6%(-2.04)#12,186 |
| 38. | 00715 | 5.6% | 5.1%(+0.499)#38 | 7.6%(-2.09)#12,301 |
| 39. | 00769 | 5.5% | 5.1%(+0.481)#39 | 7.6%(-2.11)#12,363 |
| 40. | 00716 | 5.5% | 5.1%(+0.452)#40 | 7.6%(-2.14)#12,428 |
| 41. | 00692 | 5.5% | 5.1%(+0.418)#41 | 7.6%(-2.17)#12,511 |
| 42. | 00918 | 5.4% | 5.1%(+0.340)#42 | 7.6%(-2.25)#12,690 |
| 43. | 00714 | 5.4% | 5.1%(+0.328)#43 | 7.6%(-2.26)#12,726 |
| 44. | 00927 | 5.4% | 5.1%(+0.314)#44 | 7.6%(-2.28)#12,746 |
| 45. | 00739 | 5.3% | 5.1%(+0.239)#45 | 7.6%(-2.35)#12,955 |
| 46. | 00795 | 5.2% | 5.1%(+0.178)#46 | 7.6%(-2.41)#13,105 |
| 47. | 00976 | 5.2% | 5.1%(+0.173)#47 | 7.6%(-2.42)#13,115 |
| 48. | 00638 | 5.2% | 5.1%(+0.120)#48 | 7.6%(-2.47)#13,244 |
| 49. | 00664 | 5.2% | 5.1%(+0.101)#49 | 7.6%(-2.49)#13,280 |
| 50. | 00653 | 5.0% | 5.1%(-0.029)#50 | 7.6%(-2.62)#13,600 |
| 51. | 00983 | 5.0% | 5.1%(-0.042)#51 | 7.6%(-2.63)#13,630 |
| 52. | 00773 | 5.0% | 5.1%(-0.073)#52 | 7.6%(-2.66)#13,721 |
| 53. | 00729 | 5.0% | 5.1%(-0.101)#53 | 7.6%(-2.69)#13,811 |
| 54. | 00794 | 4.9% | 5.1%(-0.158)#54 | 7.6%(-2.75)#13,982 |
| 55. | 00949 | 4.9% | 5.1%(-0.169)#55 | 7.6%(-2.76)#14,011 |
| 56. | 00703 | 4.8% | 5.1%(-0.260)#56 | 7.6%(-2.85)#14,259 |
| 57. | 00953 | 4.8% | 5.1%(-0.295)#57 | 7.6%(-2.89)#14,360 |
| 58. | 00725 | 4.7% | 5.1%(-0.313)#58 | 7.6%(-2.90)#14,390 |
| 59. | 00659 | 4.7% | 5.1%(-0.331)#59 | 7.6%(-2.92)#14,443 |
| 60. | 00971 | 4.7% | 5.1%(-0.354)#60 | 7.6%(-2.95)#14,515 |
| 61. | 00612 | 4.6% | 5.1%(-0.440)#61 | 7.6%(-3.03)#14,754 |
| 62. | 00765 | 4.6% | 5.1%(-0.466)#62 | 7.6%(-3.06)#14,828 |
| 63. | 00678 | 4.4% | 5.1%(-0.613)#63 | 7.6%(-3.20)#15,214 |
| 64. | 00623 | 4.4% | 5.1%(-0.686)#64 | 7.6%(-3.28)#15,395 |
| 65. | 00917 | 4.3% | 5.1%(-0.729)#65 | 7.6%(-3.32)#15,507 |
| 66. | 00920 | 4.3% | 5.1%(-0.756)#66 | 7.6%(-3.35)#15,558 |
| 67. | 00754 | 4.2% | 5.1%(-0.810)#67 | 7.6%(-3.40)#15,686 |
| 68. | 00680 | 4.2% | 5.1%(-0.824)#68 | 7.6%(-3.42)#15,729 |
| 69. | 00901 | 4.2% | 5.1%(-0.827)#69 | 7.6%(-3.42)#15,739 |
| 70. | 00957 | 4.2% | 5.1%(-0.863)#70 | 7.6%(-3.45)#15,823 |
| 71. | 00956 | 4.2% | 5.1%(-0.869)#71 | 7.6%(-3.46)#15,829 |
| 72. | 00962 | 4.0% | 5.1%(-1.01)#72 | 7.6%(-3.60)#16,233 |
| 73. | 00987 | 4.0% | 5.1%(-1.10)#73 | 7.6%(-3.69)#16,486 |
| 74. | 00924 | 3.9% | 5.1%(-1.12)#74 | 7.6%(-3.71)#16,521 |
| 75. | 00601 | 3.7% | 5.1%(-1.32)#75 | 7.6%(-3.91)#17,048 |
| 76. | 00670 | 3.6% | 5.1%(-1.43)#76 | 7.6%(-4.02)#17,338 |
| 77. | 00617 | 3.6% | 5.1%(-1.49)#77 | 7.6%(-4.08)#17,514 |
| 78. | 00683 | 3.5% | 5.1%(-1.54)#78 | 7.6%(-4.13)#17,614 |
| 79. | 00771 | 3.2% | 5.1%(-1.81)#79 | 7.6%(-4.40)#18,282 |
| 80. | 00728 | 3.2% | 5.1%(-1.81)#80 | 7.6%(-4.40)#18,290 |
| 81. | 00616 | 3.2% | 5.1%(-1.90)#81 | 7.6%(-4.49)#18,490 |
| 82. | 00637 | 3.1% | 5.1%(-1.93)#82 | 7.6%(-4.52)#18,559 |
| 83. | 00705 | 3.1% | 5.1%(-1.97)#83 | 7.6%(-4.56)#18,665 |
| 84. | 00767 | 3.0% | 5.1%(-2.03)#84 | 7.6%(-4.62)#18,840 |
| 85. | 00960 | 3.0% | 5.1%(-2.06)#85 | 7.6%(-4.65)#18,890 |
| 86. | 00676 | 3.0% | 5.1%(-2.07)#86 | 7.6%(-4.66)#18,919 |
| 87. | 00688 | 3.0% | 5.1%(-2.09)#87 | 7.6%(-4.69)#18,985 |
| 88. | 00985 | 3.0% | 5.1%(-2.10)#88 | 7.6%(-4.69)#19,006 |
| 89. | 00660 | 2.9% | 5.1%(-2.12)#89 | 7.6%(-4.71)#19,051 |
| 90. | 00669 | 2.8% | 5.1%(-2.22)#90 | 7.6%(-4.82)#19,232 |
| 91. | 00923 | 2.8% | 5.1%(-2.23)#91 | 7.6%(-4.82)#19,242 |
| 92. | 00718 | 2.8% | 5.1%(-2.23)#92 | 7.6%(-4.82)#19,243 |
| 93. | 00627 | 2.8% | 5.1%(-2.23)#93 | 7.6%(-4.82)#19,246 |
| 94. | 00784 | 2.8% | 5.1%(-2.25)#94 | 7.6%(-4.84)#19,283 |
| 95. | 00766 | 2.8% | 5.1%(-2.27)#95 | 7.6%(-4.86)#19,323 |
| 96. | 00602 | 2.8% | 5.1%(-2.30)#96 | 7.6%(-4.90)#19,412 |
| 97. | 00735 | 2.7% | 5.1%(-2.32)#97 | 7.6%(-4.91)#19,432 |
| 98. | 00730 | 2.7% | 5.1%(-2.34)#98 | 7.6%(-4.93)#19,484 |
| 99. | 00911 | 2.7% | 5.1%(-2.39)#99 | 7.6%(-4.98)#19,594 |
| 100. | 00745 | 2.6% | 5.1%(-2.42)#100 | 7.6%(-5.01)#19,662 |
1
2Common Questions
What are the Top 10 Zip Codes with the Highest Percentage of Population with a Degree in Engineering in Puerto Rico?
Top 10 Zip Codes with the Highest Percentage of Population with a Degree in Engineering in Puerto Rico are:
What zip code has the Highest Percentage of Population with a Degree in Engineering in Puerto Rico?
00968 has the Highest Percentage of Population with a Degree in Engineering in Puerto Rico with 13.3%.
What is the Percentage of Population with a Degree in Engineering in the State of Puerto Rico?
Percentage of Population with a Degree in Engineering in Puerto Rico is 5.1%.
What is the Percentage of Population with a Degree in Engineering in the United States?
Percentage of Population with a Degree in Engineering in the United States is 7.6%.