Zip Codes with the Highest Percentage of Population with a Degree in Engineering in New Jersey
RELATED REPORTS & OPTIONS
Engineering
New Jersey
Compare Zip Codes
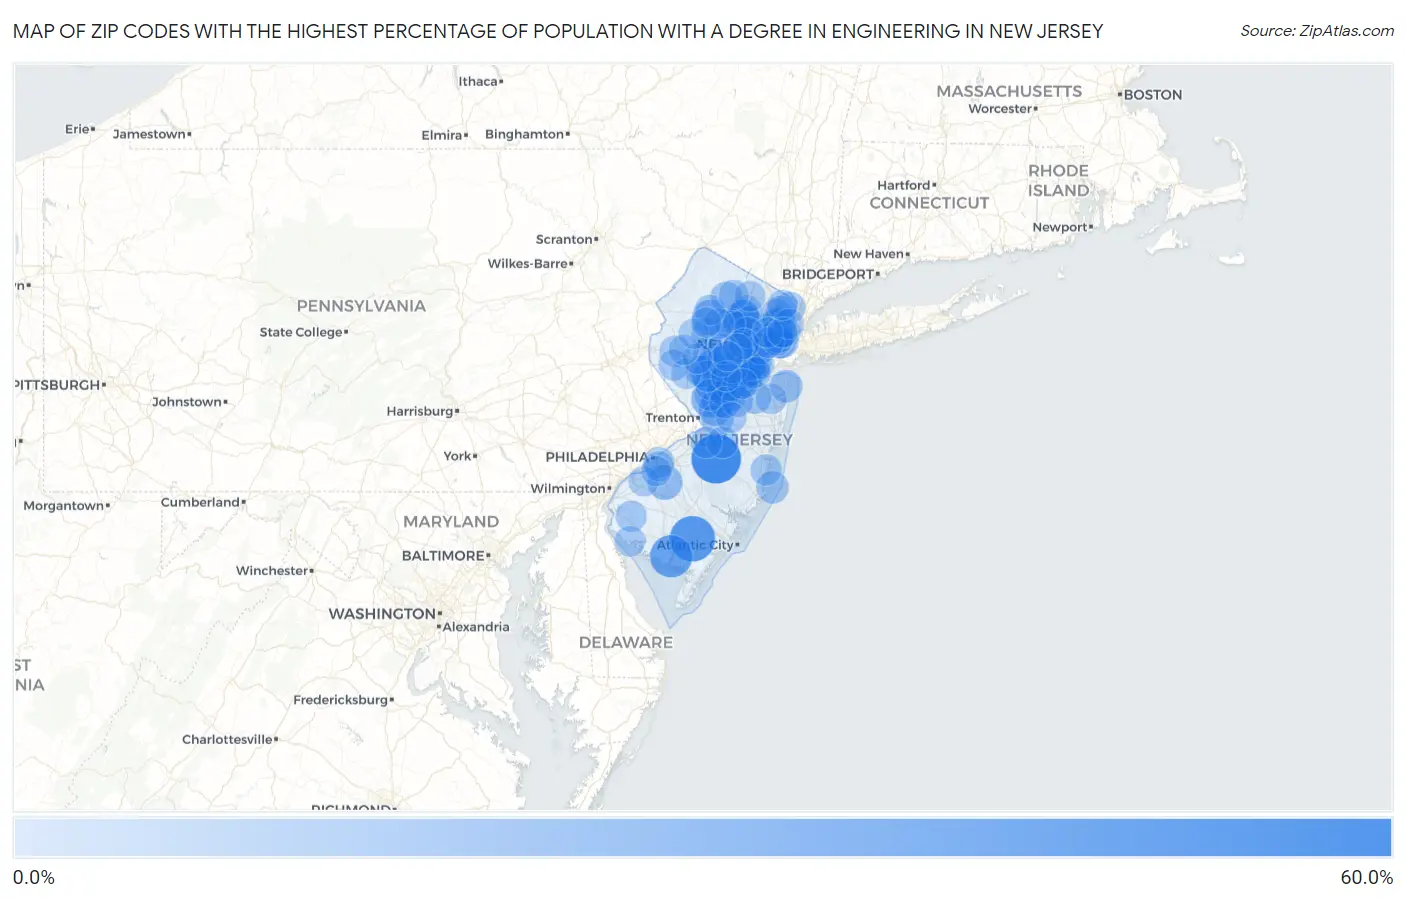
Map of Zip Codes with the Highest Percentage of Population with a Degree in Engineering in New Jersey
0.0%
60.0%
Zip Codes with the Highest Percentage of Population with a Degree in Engineering in New Jersey
| Zip Code | % Graduates | vs State | vs National | |
| 1. | 08064 | 51.6% | 8.3%(+43.3)#1 | 7.6%(+44.0)#123 |
| 2. | 08317 | 42.8% | 8.3%(+34.5)#2 | 7.6%(+35.1)#193 |
| 3. | 08329 | 36.0% | 8.3%(+27.7)#3 | 7.6%(+28.4)#262 |
| 4. | 08544 | 25.6% | 8.3%(+17.3)#4 | 7.6%(+18.0)#519 |
| 5. | 07073 | 23.1% | 8.3%(+14.8)#5 | 7.6%(+15.5)#645 |
| 6. | 08821 | 22.0% | 8.3%(+13.7)#6 | 7.6%(+14.3)#720 |
| 7. | 07852 | 21.6% | 8.3%(+13.3)#7 | 7.6%(+13.9)#755 |
| 8. | 07034 | 21.2% | 8.3%(+12.9)#8 | 7.6%(+13.6)#788 |
| 9. | 08032 | 20.0% | 8.3%(+11.7)#9 | 7.6%(+12.4)#920 |
| 10. | 07074 | 19.9% | 8.3%(+11.6)#10 | 7.6%(+12.3)#926 |
| 11. | 08536 | 19.7% | 8.3%(+11.4)#11 | 7.6%(+12.1)#939 |
| 12. | 08810 | 19.3% | 8.3%(+11.0)#12 | 7.6%(+11.6)#992 |
| 13. | 07310 | 19.0% | 8.3%(+10.7)#13 | 7.6%(+11.4)#1,022 |
| 14. | 08820 | 18.7% | 8.3%(+10.4)#14 | 7.6%(+11.1)#1,068 |
| 15. | 07095 | 18.6% | 8.3%(+10.3)#15 | 7.6%(+10.9)#1,081 |
| 16. | 08550 | 17.7% | 8.3%(+9.39)#16 | 7.6%(+10.0)#1,199 |
| 17. | 07054 | 17.5% | 8.3%(+9.19)#17 | 7.6%(+9.84)#1,222 |
| 18. | 07092 | 17.0% | 8.3%(+8.73)#18 | 7.6%(+9.38)#1,312 |
| 19. | 08807 | 16.6% | 8.3%(+8.33)#19 | 7.6%(+8.98)#1,385 |
| 20. | 08502 | 16.6% | 8.3%(+8.26)#20 | 7.6%(+8.91)#1,394 |
| 21. | 07029 | 16.5% | 8.3%(+8.18)#21 | 7.6%(+8.83)#1,405 |
| 22. | 07001 | 16.3% | 8.3%(+8.03)#22 | 7.6%(+8.68)#1,435 |
| 23. | 08817 | 15.8% | 8.3%(+7.51)#23 | 7.6%(+8.16)#1,542 |
| 24. | 08863 | 15.5% | 8.3%(+7.25)#24 | 7.6%(+7.89)#1,599 |
| 25. | 08812 | 15.4% | 8.3%(+7.11)#25 | 7.6%(+7.76)#1,639 |
| 26. | 07732 | 15.3% | 8.3%(+7.04)#26 | 7.6%(+7.69)#1,668 |
| 27. | 07751 | 15.1% | 8.3%(+6.81)#27 | 7.6%(+7.46)#1,720 |
| 28. | 07930 | 14.8% | 8.3%(+6.47)#28 | 7.6%(+7.12)#1,808 |
| 29. | 08691 | 14.6% | 8.3%(+6.32)#29 | 7.6%(+6.97)#1,837 |
| 30. | 08006 | 14.6% | 8.3%(+6.31)#30 | 7.6%(+6.96)#1,841 |
| 31. | 08816 | 14.5% | 8.3%(+6.21)#31 | 7.6%(+6.86)#1,866 |
| 32. | 07662 | 14.3% | 8.3%(+6.00)#32 | 7.6%(+6.65)#1,924 |
| 33. | 08837 | 14.3% | 8.3%(+5.99)#33 | 7.6%(+6.64)#1,926 |
| 34. | 08852 | 14.2% | 8.3%(+5.93)#34 | 7.6%(+6.58)#1,958 |
| 35. | 07094 | 14.1% | 8.3%(+5.82)#35 | 7.6%(+6.47)#1,987 |
| 36. | 07921 | 14.1% | 8.3%(+5.76)#36 | 7.6%(+6.41)#1,992 |
| 37. | 08823 | 14.1% | 8.3%(+5.76)#37 | 7.6%(+6.41)#1,995 |
| 38. | 08872 | 14.0% | 8.3%(+5.73)#38 | 7.6%(+6.38)#2,006 |
| 39. | 08869 | 14.0% | 8.3%(+5.70)#39 | 7.6%(+6.35)#2,010 |
| 40. | 07082 | 13.6% | 8.3%(+5.31)#40 | 7.6%(+5.96)#2,169 |
| 41. | 08824 | 13.6% | 8.3%(+5.26)#41 | 7.6%(+5.91)#2,181 |
| 42. | 08830 | 13.5% | 8.3%(+5.24)#42 | 7.6%(+5.89)#2,194 |
| 43. | 07302 | 13.5% | 8.3%(+5.19)#43 | 7.6%(+5.84)#2,229 |
| 44. | 07078 | 13.4% | 8.3%(+5.06)#44 | 7.6%(+5.71)#2,271 |
| 45. | 08511 | 13.3% | 8.3%(+5.04)#45 | 7.6%(+5.69)#2,280 |
| 46. | 07438 | 13.3% | 8.3%(+4.99)#46 | 7.6%(+5.64)#2,307 |
| 47. | 08853 | 13.2% | 8.3%(+4.95)#47 | 7.6%(+5.60)#2,328 |
| 48. | 08540 | 13.0% | 8.3%(+4.66)#48 | 7.6%(+5.31)#2,423 |
| 49. | 08022 | 12.9% | 8.3%(+4.65)#49 | 7.6%(+5.30)#2,424 |
| 50. | 07627 | 12.8% | 8.3%(+4.50)#50 | 7.6%(+5.15)#2,495 |
| 51. | 07058 | 12.8% | 8.3%(+4.50)#51 | 7.6%(+5.15)#2,496 |
| 52. | 08902 | 12.6% | 8.3%(+4.31)#52 | 7.6%(+4.96)#2,575 |
| 53. | 08512 | 12.6% | 8.3%(+4.27)#53 | 7.6%(+4.91)#2,591 |
| 54. | 08734 | 12.5% | 8.3%(+4.21)#54 | 7.6%(+4.86)#2,617 |
| 55. | 08831 | 12.4% | 8.3%(+4.15)#55 | 7.6%(+4.80)#2,654 |
| 56. | 07981 | 12.4% | 8.3%(+4.10)#56 | 7.6%(+4.75)#2,680 |
| 57. | 07045 | 12.4% | 8.3%(+4.06)#57 | 7.6%(+4.71)#2,703 |
| 58. | 07661 | 12.3% | 8.3%(+4.04)#58 | 7.6%(+4.69)#2,717 |
| 59. | 07008 | 12.3% | 8.3%(+4.04)#59 | 7.6%(+4.69)#2,718 |
| 60. | 08854 | 12.3% | 8.3%(+4.04)#60 | 7.6%(+4.69)#2,719 |
| 61. | 08827 | 12.3% | 8.3%(+4.04)#61 | 7.6%(+4.69)#2,720 |
| 62. | 08844 | 12.3% | 8.3%(+4.02)#62 | 7.6%(+4.67)#2,735 |
| 63. | 07208 | 12.3% | 8.3%(+3.97)#63 | 7.6%(+4.61)#2,770 |
| 64. | 08001 | 12.1% | 8.3%(+3.78)#64 | 7.6%(+4.43)#2,855 |
| 65. | 08836 | 12.1% | 8.3%(+3.76)#65 | 7.6%(+4.41)#2,860 |
| 66. | 08861 | 12.0% | 8.3%(+3.75)#66 | 7.6%(+4.40)#2,869 |
| 67. | 07974 | 12.0% | 8.3%(+3.73)#67 | 7.6%(+4.38)#2,879 |
| 68. | 07039 | 11.8% | 8.3%(+3.49)#68 | 7.6%(+4.14)#3,006 |
| 69. | 07093 | 11.8% | 8.3%(+3.49)#69 | 7.6%(+4.14)#3,008 |
| 70. | 07306 | 11.8% | 8.3%(+3.48)#70 | 7.6%(+4.13)#3,010 |
| 71. | 08104 | 11.7% | 8.3%(+3.39)#71 | 7.6%(+4.04)#3,060 |
| 72. | 08867 | 11.5% | 8.3%(+3.24)#72 | 7.6%(+3.89)#3,139 |
| 73. | 07307 | 11.5% | 8.3%(+3.20)#73 | 7.6%(+3.85)#3,175 |
| 74. | 07950 | 11.5% | 8.3%(+3.17)#74 | 7.6%(+3.82)#3,199 |
| 75. | 07420 | 11.4% | 8.3%(+3.13)#75 | 7.6%(+3.78)#3,232 |
| 76. | 07920 | 11.4% | 8.3%(+3.11)#76 | 7.6%(+3.76)#3,246 |
| 77. | 07105 | 11.4% | 8.3%(+3.06)#77 | 7.6%(+3.71)#3,289 |
| 78. | 07738 | 11.2% | 8.3%(+2.95)#78 | 7.6%(+3.60)#3,364 |
| 79. | 08323 | 11.2% | 8.3%(+2.93)#79 | 7.6%(+3.58)#3,379 |
| 80. | 07869 | 11.2% | 8.3%(+2.92)#80 | 7.6%(+3.57)#3,386 |
| 81. | 07901 | 11.2% | 8.3%(+2.86)#81 | 7.6%(+3.51)#3,428 |
| 82. | 08822 | 10.9% | 8.3%(+2.63)#82 | 7.6%(+3.28)#3,593 |
| 83. | 08555 | 10.9% | 8.3%(+2.61)#83 | 7.6%(+3.26)#3,614 |
| 84. | 07843 | 10.8% | 8.3%(+2.54)#84 | 7.6%(+3.19)#3,663 |
| 85. | 08889 | 10.8% | 8.3%(+2.54)#85 | 7.6%(+3.19)#3,666 |
| 86. | 08882 | 10.8% | 8.3%(+2.49)#86 | 7.6%(+3.14)#3,713 |
| 87. | 08829 | 10.8% | 8.3%(+2.46)#87 | 7.6%(+3.11)#3,731 |
| 88. | 07024 | 10.7% | 8.3%(+2.44)#88 | 7.6%(+3.09)#3,742 |
| 89. | 07922 | 10.7% | 8.3%(+2.38)#89 | 7.6%(+3.03)#3,802 |
| 90. | 08056 | 10.6% | 8.3%(+2.33)#90 | 7.6%(+2.98)#3,847 |
| 91. | 08873 | 10.6% | 8.3%(+2.31)#91 | 7.6%(+2.96)#3,870 |
| 92. | 07109 | 10.6% | 8.3%(+2.31)#92 | 7.6%(+2.96)#3,878 |
| 93. | 08030 | 10.5% | 8.3%(+2.24)#93 | 7.6%(+2.89)#3,941 |
| 94. | 08093 | 10.5% | 8.3%(+2.23)#94 | 7.6%(+2.88)#3,948 |
| 95. | 07853 | 10.5% | 8.3%(+2.17)#95 | 7.6%(+2.82)#4,008 |
| 96. | 07435 | 10.5% | 8.3%(+2.16)#96 | 7.6%(+2.81)#4,018 |
| 97. | 07836 | 10.4% | 8.3%(+2.15)#97 | 7.6%(+2.80)#4,028 |
| 98. | 07047 | 10.4% | 8.3%(+2.14)#98 | 7.6%(+2.79)#4,043 |
| 99. | 07630 | 10.4% | 8.3%(+2.13)#99 | 7.6%(+2.78)#4,053 |
| 100. | 07059 | 10.4% | 8.3%(+2.09)#100 | 7.6%(+2.74)#4,085 |
Common Questions
What are the Top 10 Zip Codes with the Highest Percentage of Population with a Degree in Engineering in New Jersey?
Top 10 Zip Codes with the Highest Percentage of Population with a Degree in Engineering in New Jersey are:
What zip code has the Highest Percentage of Population with a Degree in Engineering in New Jersey?
08064 has the Highest Percentage of Population with a Degree in Engineering in New Jersey with 51.6%.
What is the Percentage of Population with a Degree in Engineering in the State of New Jersey?
Percentage of Population with a Degree in Engineering in New Jersey is 8.3%.
What is the Percentage of Population with a Degree in Engineering in the United States?
Percentage of Population with a Degree in Engineering in the United States is 7.6%.