Zip Codes with the Highest Percentage of Population with a Degree in Engineering in Hawaii
RELATED REPORTS & OPTIONS
Engineering
Hawaii
Compare Zip Codes
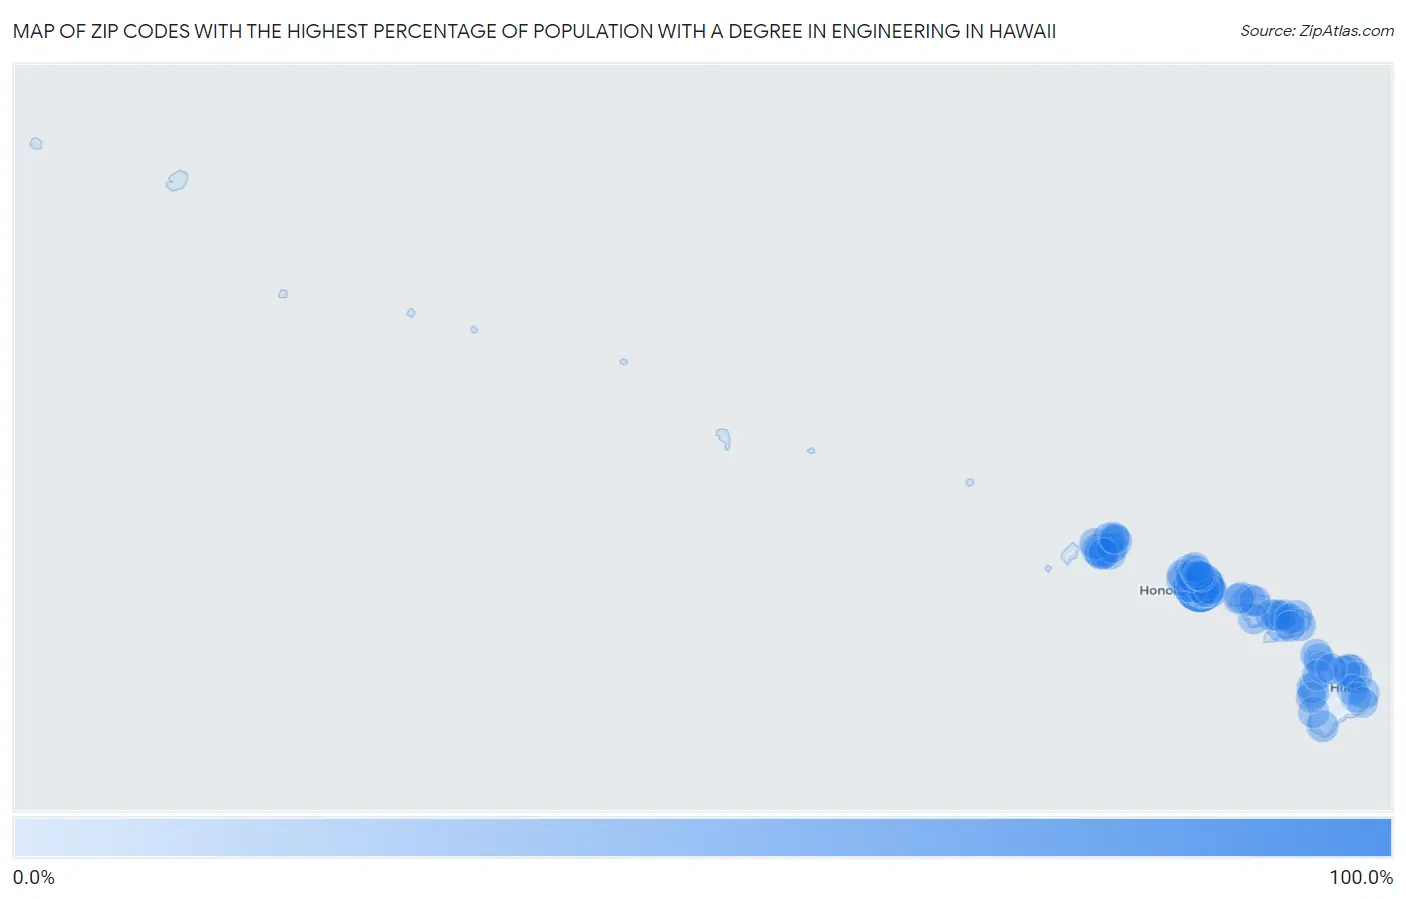
Map of Zip Codes with the Highest Percentage of Population with a Degree in Engineering in Hawaii
0.0%
100.0%
Zip Codes with the Highest Percentage of Population with a Degree in Engineering in Hawaii
| Zip Code | % Graduates | vs State | vs National | |
| 1. | 96858 | 100.0% | 6.5%(+93.5)#1 | 7.6%(+92.4)#14 |
| 2. | 96860 | 30.5% | 6.5%(+24.1)#2 | 7.6%(+22.9)#361 |
| 3. | 96848 | 19.6% | 6.5%(+13.1)#3 | 7.6%(+11.9)#957 |
| 4. | 96780 | 14.9% | 6.5%(+8.43)#4 | 7.6%(+7.25)#1,771 |
| 5. | 96741 | 12.2% | 6.5%(+5.69)#5 | 7.6%(+4.51)#2,814 |
| 6. | 96796 | 11.0% | 6.5%(+4.51)#6 | 7.6%(+3.33)#3,565 |
| 7. | 96764 | 9.6% | 6.5%(+3.18)#7 | 7.6%(+2.00)#4,804 |
| 8. | 96722 | 9.4% | 6.5%(+2.92)#8 | 7.6%(+1.74)#5,106 |
| 9. | 96708 | 9.3% | 6.5%(+2.84)#9 | 7.6%(+1.66)#5,189 |
| 10. | 96716 | 9.2% | 6.5%(+2.75)#10 | 7.6%(+1.57)#5,300 |
| 11. | 96746 | 9.0% | 6.5%(+2.52)#11 | 7.6%(+1.34)#5,629 |
| 12. | 96825 | 8.9% | 6.5%(+2.43)#12 | 7.6%(+1.25)#5,748 |
| 13. | 96792 | 8.7% | 6.5%(+2.24)#13 | 7.6%(+1.06)#6,007 |
| 14. | 96826 | 8.6% | 6.5%(+2.17)#14 | 7.6%(+0.996)#6,094 |
| 15. | 96719 | 8.6% | 6.5%(+2.16)#15 | 7.6%(+0.983)#6,109 |
| 16. | 96701 | 8.2% | 6.5%(+1.76)#16 | 7.6%(+0.586)#6,695 |
| 17. | 96821 | 8.1% | 6.5%(+1.63)#17 | 7.6%(+0.450)#6,938 |
| 18. | 96713 | 8.0% | 6.5%(+1.51)#18 | 7.6%(+0.331)#7,128 |
| 19. | 96772 | 8.0% | 6.5%(+1.51)#19 | 7.6%(+0.327)#7,136 |
| 20. | 96789 | 7.9% | 6.5%(+1.45)#20 | 7.6%(+0.275)#7,236 |
| 21. | 96814 | 7.6% | 6.5%(+1.13)#21 | 7.6%(-0.051)#7,833 |
| 22. | 96728 | 7.6% | 6.5%(+1.09)#22 | 7.6%(-0.085)#7,891 |
| 23. | 96819 | 7.5% | 6.5%(+1.01)#23 | 7.6%(-0.169)#8,041 |
| 24. | 96797 | 7.5% | 6.5%(+1.00)#24 | 7.6%(-0.178)#8,065 |
| 25. | 96712 | 7.5% | 6.5%(+0.999)#25 | 7.6%(-0.180)#8,069 |
| 26. | 96815 | 7.4% | 6.5%(+0.963)#26 | 7.6%(-0.216)#8,130 |
| 27. | 96782 | 7.4% | 6.5%(+0.927)#27 | 7.6%(-0.252)#8,210 |
| 28. | 96817 | 7.3% | 6.5%(+0.824)#28 | 7.6%(-0.355)#8,397 |
| 29. | 96818 | 7.1% | 6.5%(+0.651)#29 | 7.6%(-0.528)#8,727 |
| 30. | 96747 | 7.0% | 6.5%(+0.549)#30 | 7.6%(-0.630)#8,935 |
| 31. | 96822 | 7.0% | 6.5%(+0.492)#31 | 7.6%(-0.687)#9,083 |
| 32. | 96725 | 6.9% | 6.5%(+0.411)#32 | 7.6%(-0.768)#9,250 |
| 33. | 96744 | 6.8% | 6.5%(+0.318)#33 | 7.6%(-0.861)#9,422 |
| 34. | 96813 | 6.7% | 6.5%(+0.241)#34 | 7.6%(-0.938)#9,606 |
| 35. | 96756 | 6.7% | 6.5%(+0.189)#35 | 7.6%(-0.990)#9,711 |
| 36. | 96740 | 6.6% | 6.5%(+0.154)#36 | 7.6%(-1.02)#9,776 |
| 37. | 96757 | 6.6% | 6.5%(+0.149)#37 | 7.6%(-1.03)#9,787 |
| 38. | 96707 | 6.4% | 6.5%(-0.072)#38 | 7.6%(-1.25)#10,239 |
| 39. | 96734 | 6.2% | 6.5%(-0.262)#39 | 7.6%(-1.44)#10,693 |
| 40. | 96774 | 6.1% | 6.5%(-0.346)#40 | 7.6%(-1.53)#10,903 |
| 41. | 96706 | 6.1% | 6.5%(-0.376)#41 | 7.6%(-1.56)#10,967 |
| 42. | 96791 | 5.9% | 6.5%(-0.529)#42 | 7.6%(-1.71)#11,342 |
| 43. | 96752 | 5.9% | 6.5%(-0.570)#43 | 7.6%(-1.75)#11,436 |
| 44. | 96753 | 5.7% | 6.5%(-0.798)#44 | 7.6%(-1.98)#12,017 |
| 45. | 96816 | 5.3% | 6.5%(-1.16)#45 | 7.6%(-2.34)#12,913 |
| 46. | 96786 | 5.2% | 6.5%(-1.27)#46 | 7.6%(-2.45)#13,198 |
| 47. | 96732 | 5.1% | 6.5%(-1.34)#47 | 7.6%(-2.52)#13,340 |
| 48. | 96795 | 5.1% | 6.5%(-1.35)#48 | 7.6%(-2.53)#13,391 |
| 49. | 96704 | 5.0% | 6.5%(-1.43)#49 | 7.6%(-2.61)#13,578 |
| 50. | 96729 | 5.0% | 6.5%(-1.44)#50 | 7.6%(-2.62)#13,591 |
| 51. | 96749 | 5.0% | 6.5%(-1.51)#51 | 7.6%(-2.69)#13,814 |
| 52. | 96761 | 4.9% | 6.5%(-1.57)#52 | 7.6%(-2.75)#13,966 |
| 53. | 96762 | 4.6% | 6.5%(-1.89)#53 | 7.6%(-3.07)#14,855 |
| 54. | 96743 | 4.6% | 6.5%(-1.91)#54 | 7.6%(-3.09)#14,904 |
| 55. | 96755 | 4.4% | 6.5%(-2.05)#55 | 7.6%(-3.22)#15,278 |
| 56. | 96779 | 4.4% | 6.5%(-2.08)#56 | 7.6%(-3.25)#15,344 |
| 57. | 96763 | 4.3% | 6.5%(-2.13)#57 | 7.6%(-3.31)#15,495 |
| 58. | 96793 | 4.3% | 6.5%(-2.17)#58 | 7.6%(-3.35)#15,564 |
| 59. | 96748 | 4.2% | 6.5%(-2.24)#59 | 7.6%(-3.41)#15,727 |
| 60. | 96766 | 4.1% | 6.5%(-2.41)#60 | 7.6%(-3.59)#16,192 |
| 61. | 96754 | 3.9% | 6.5%(-2.61)#61 | 7.6%(-3.79)#16,732 |
| 62. | 96770 | 3.4% | 6.5%(-3.05)#62 | 7.6%(-4.23)#17,856 |
| 63. | 96705 | 3.3% | 6.5%(-3.19)#63 | 7.6%(-4.37)#18,191 |
| 64. | 96750 | 3.2% | 6.5%(-3.26)#64 | 7.6%(-4.44)#18,374 |
| 65. | 96738 | 3.1% | 6.5%(-3.40)#65 | 7.6%(-4.58)#18,729 |
| 66. | 96768 | 3.0% | 6.5%(-3.43)#66 | 7.6%(-4.61)#18,810 |
| 67. | 96720 | 2.6% | 6.5%(-3.83)#67 | 7.6%(-5.01)#19,670 |
| 68. | 96727 | 2.5% | 6.5%(-3.98)#68 | 7.6%(-5.16)#19,999 |
| 69. | 96790 | 2.0% | 6.5%(-4.42)#69 | 7.6%(-5.60)#20,852 |
| 70. | 96778 | 1.7% | 6.5%(-4.76)#70 | 7.6%(-5.94)#21,495 |
| 71. | 96731 | 1.4% | 6.5%(-5.08)#71 | 7.6%(-6.26)#22,017 |
| 72. | 96730 | 1.4% | 6.5%(-5.10)#72 | 7.6%(-6.28)#22,046 |
| 73. | 96771 | 1.2% | 6.5%(-5.30)#73 | 7.6%(-6.48)#22,368 |
| 74. | 96717 | 1.0% | 6.5%(-5.43)#74 | 7.6%(-6.61)#22,569 |
| 75. | 96703 | 0.93% | 6.5%(-5.53)#75 | 7.6%(-6.71)#22,710 |
1
Common Questions
What are the Top 10 Zip Codes with the Highest Percentage of Population with a Degree in Engineering in Hawaii?
Top 10 Zip Codes with the Highest Percentage of Population with a Degree in Engineering in Hawaii are:
What zip code has the Highest Percentage of Population with a Degree in Engineering in Hawaii?
96858 has the Highest Percentage of Population with a Degree in Engineering in Hawaii with 100.0%.
What is the Percentage of Population with a Degree in Engineering in the State of Hawaii?
Percentage of Population with a Degree in Engineering in Hawaii is 6.5%.
What is the Percentage of Population with a Degree in Engineering in the United States?
Percentage of Population with a Degree in Engineering in the United States is 7.6%.