Zip Codes with the Highest Percentage of Population with a Degree in Engineering in Virginia
RELATED REPORTS & OPTIONS
Engineering
Virginia
Compare Zip Codes
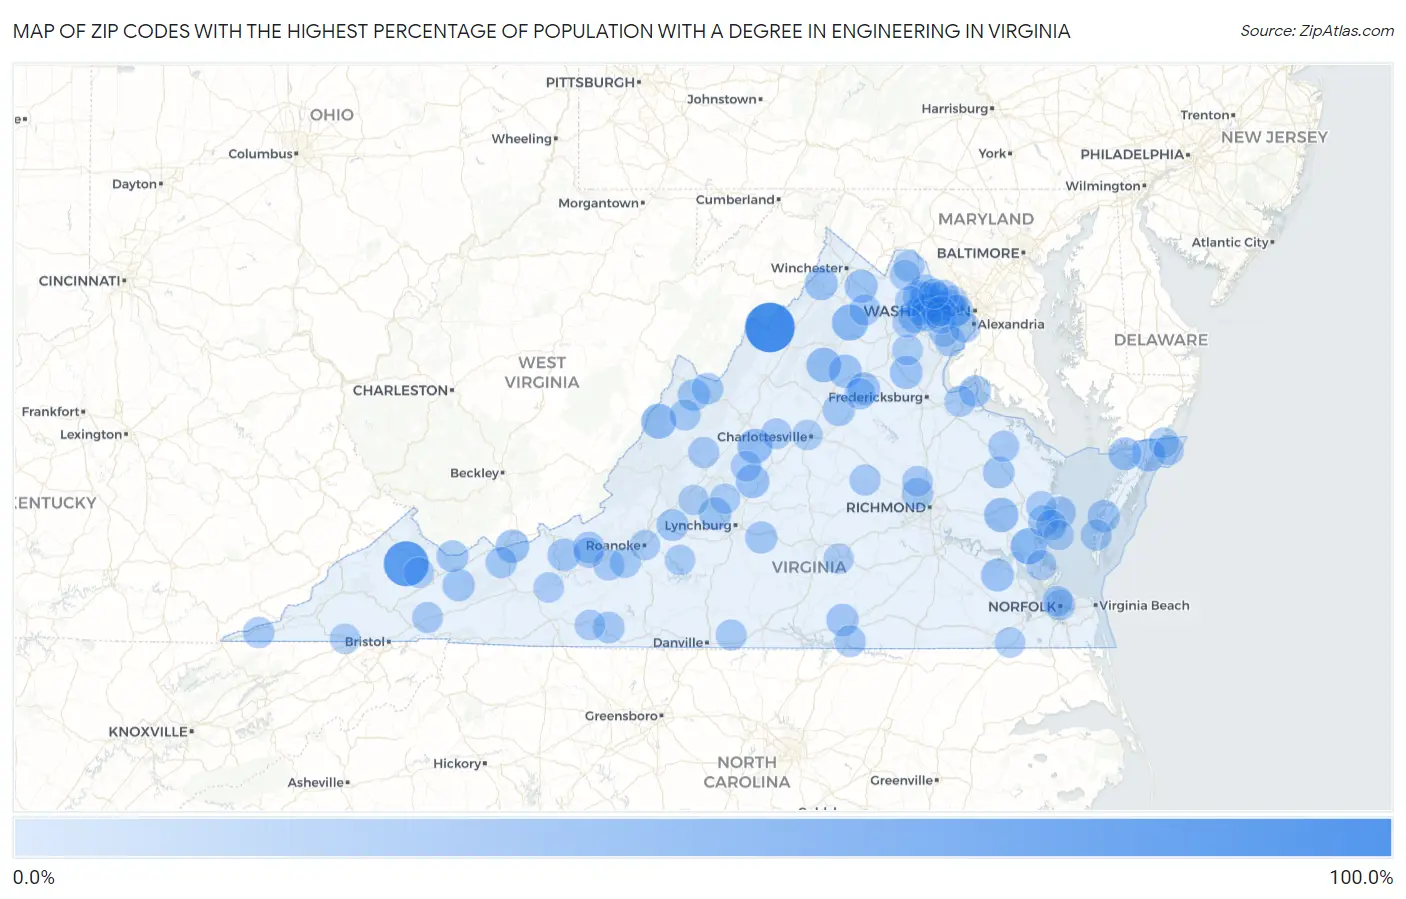
Map of Zip Codes with the Highest Percentage of Population with a Degree in Engineering in Virginia
0.0%
100.0%
Zip Codes with the Highest Percentage of Population with a Degree in Engineering in Virginia
| Zip Code | % Graduates | vs State | vs National | |
| 1. | 22845 | 100.0% | 7.9%(+92.1)#1 | 7.6%(+92.4)#40 |
| 2. | 24646 | 78.4% | 7.9%(+70.4)#2 | 7.6%(+70.7)#57 |
| 3. | 22640 | 37.7% | 7.9%(+29.7)#3 | 7.6%(+30.0)#237 |
| 4. | 23691 | 37.5% | 7.9%(+29.6)#4 | 7.6%(+29.9)#241 |
| 5. | 24484 | 32.6% | 7.9%(+24.6)#5 | 7.6%(+24.9)#318 |
| 6. | 22952 | 31.0% | 7.9%(+23.1)#6 | 7.6%(+23.4)#351 |
| 7. | 22743 | 30.4% | 7.9%(+22.5)#7 | 7.6%(+22.8)#365 |
| 8. | 23011 | 29.0% | 7.9%(+21.0)#8 | 7.6%(+21.3)#389 |
| 9. | 22964 | 25.8% | 7.9%(+17.8)#9 | 7.6%(+18.1)#510 |
| 10. | 24366 | 25.0% | 7.9%(+17.1)#10 | 7.6%(+17.4)#551 |
| 11. | 22735 | 24.3% | 7.9%(+16.4)#11 | 7.6%(+16.7)#588 |
| 12. | 20143 | 23.8% | 7.9%(+15.9)#12 | 7.6%(+16.2)#607 |
| 13. | 23303 | 23.3% | 7.9%(+15.4)#13 | 7.6%(+15.7)#638 |
| 14. | 22620 | 23.3% | 7.9%(+15.3)#14 | 7.6%(+15.6)#640 |
| 15. | 22720 | 22.9% | 7.9%(+15.0)#15 | 7.6%(+15.3)#657 |
| 16. | 22641 | 22.9% | 7.9%(+15.0)#16 | 7.6%(+15.3)#658 |
| 17. | 23846 | 22.7% | 7.9%(+14.8)#17 | 7.6%(+15.1)#665 |
| 18. | 23427 | 22.2% | 7.9%(+14.3)#18 | 7.6%(+14.6)#709 |
| 19. | 22729 | 21.7% | 7.9%(+13.8)#19 | 7.6%(+14.1)#734 |
| 20. | 24536 | 21.4% | 7.9%(+13.5)#20 | 7.6%(+13.8)#773 |
| 21. | 23354 | 20.7% | 7.9%(+12.7)#21 | 7.6%(+13.0)#843 |
| 22. | 24132 | 20.6% | 7.9%(+12.7)#22 | 7.6%(+13.0)#845 |
| 23. | 23970 | 20.4% | 7.9%(+12.5)#23 | 7.6%(+12.8)#865 |
| 24. | 24377 | 20.3% | 7.9%(+12.4)#24 | 7.6%(+12.7)#878 |
| 25. | 24593 | 19.3% | 7.9%(+11.4)#25 | 7.6%(+11.6)#989 |
| 26. | 22972 | 19.0% | 7.9%(+11.1)#26 | 7.6%(+11.4)#1,025 |
| 27. | 24458 | 18.9% | 7.9%(+10.9)#27 | 7.6%(+11.2)#1,051 |
| 28. | 23066 | 18.3% | 7.9%(+10.3)#28 | 7.6%(+10.6)#1,127 |
| 29. | 24122 | 18.1% | 7.9%(+10.1)#29 | 7.6%(+10.4)#1,156 |
| 30. | 22027 | 18.0% | 7.9%(+10.1)#30 | 7.6%(+10.4)#1,160 |
| 31. | 24602 | 17.9% | 7.9%(+9.92)#31 | 7.6%(+10.2)#1,173 |
| 32. | 20148 | 17.7% | 7.9%(+9.81)#32 | 7.6%(+10.1)#1,190 |
| 33. | 22437 | 17.7% | 7.9%(+9.75)#33 | 7.6%(+10.0)#1,198 |
| 34. | 22448 | 17.5% | 7.9%(+9.53)#34 | 7.6%(+9.82)#1,225 |
| 35. | 24171 | 17.0% | 7.9%(+9.10)#35 | 7.6%(+9.39)#1,311 |
| 36. | 23919 | 17.0% | 7.9%(+9.05)#36 | 7.6%(+9.35)#1,322 |
| 37. | 20171 | 16.9% | 7.9%(+8.94)#37 | 7.6%(+9.24)#1,336 |
| 38. | 24442 | 16.7% | 7.9%(+8.73)#38 | 7.6%(+9.02)#1,380 |
| 39. | 24060 | 16.5% | 7.9%(+8.56)#39 | 7.6%(+8.85)#1,400 |
| 40. | 23294 | 16.3% | 7.9%(+8.33)#40 | 7.6%(+8.63)#1,442 |
| 41. | 22733 | 16.3% | 7.9%(+8.32)#41 | 7.6%(+8.62)#1,445 |
| 42. | 20152 | 15.7% | 7.9%(+7.78)#42 | 7.6%(+8.07)#1,553 |
| 43. | 24314 | 15.7% | 7.9%(+7.74)#43 | 7.6%(+8.03)#1,567 |
| 44. | 23128 | 15.7% | 7.9%(+7.73)#44 | 7.6%(+8.02)#1,570 |
| 45. | 20166 | 15.2% | 7.9%(+7.31)#45 | 7.6%(+7.60)#1,688 |
| 46. | 24473 | 15.2% | 7.9%(+7.24)#46 | 7.6%(+7.53)#1,706 |
| 47. | 24281 | 15.1% | 7.9%(+7.17)#47 | 7.6%(+7.46)#1,719 |
| 48. | 23347 | 15.1% | 7.9%(+7.11)#48 | 7.6%(+7.41)#1,735 |
| 49. | 22643 | 14.9% | 7.9%(+6.95)#49 | 7.6%(+7.25)#1,772 |
| 50. | 24162 | 14.9% | 7.9%(+6.92)#50 | 7.6%(+7.21)#1,778 |
| 51. | 22182 | 14.8% | 7.9%(+6.86)#51 | 7.6%(+7.15)#1,800 |
| 52. | 24487 | 14.7% | 7.9%(+6.77)#52 | 7.6%(+7.06)#1,823 |
| 53. | 22572 | 14.4% | 7.9%(+6.50)#53 | 7.6%(+6.79)#1,881 |
| 54. | 24059 | 14.3% | 7.9%(+6.35)#54 | 7.6%(+6.64)#1,935 |
| 55. | 23063 | 14.2% | 7.9%(+6.24)#55 | 7.6%(+6.53)#1,972 |
| 56. | 22485 | 14.1% | 7.9%(+6.18)#56 | 7.6%(+6.47)#1,983 |
| 57. | 20197 | 14.0% | 7.9%(+6.07)#57 | 7.6%(+6.36)#2,008 |
| 58. | 20147 | 14.0% | 7.9%(+6.04)#58 | 7.6%(+6.33)#2,020 |
| 59. | 24594 | 13.9% | 7.9%(+5.98)#59 | 7.6%(+6.28)#2,050 |
| 60. | 24361 | 13.8% | 7.9%(+5.87)#60 | 7.6%(+6.16)#2,097 |
| 61. | 20151 | 13.8% | 7.9%(+5.84)#61 | 7.6%(+6.13)#2,108 |
| 62. | 22102 | 13.7% | 7.9%(+5.74)#62 | 7.6%(+6.04)#2,143 |
| 63. | 22043 | 13.5% | 7.9%(+5.59)#63 | 7.6%(+5.88)#2,207 |
| 64. | 22039 | 13.5% | 7.9%(+5.53)#64 | 7.6%(+5.82)#2,237 |
| 65. | 20119 | 13.1% | 7.9%(+5.20)#65 | 7.6%(+5.49)#2,358 |
| 66. | 22967 | 12.8% | 7.9%(+4.90)#66 | 7.6%(+5.19)#2,474 |
| 67. | 22943 | 12.8% | 7.9%(+4.87)#67 | 7.6%(+5.16)#2,491 |
| 68. | 20170 | 12.6% | 7.9%(+4.70)#68 | 7.6%(+5.00)#2,561 |
| 69. | 24061 | 12.5% | 7.9%(+4.56)#69 | 7.6%(+4.85)#2,619 |
| 70. | 23510 | 12.5% | 7.9%(+4.56)#70 | 7.6%(+4.85)#2,641 |
| 71. | 22066 | 12.5% | 7.9%(+4.55)#71 | 7.6%(+4.85)#2,643 |
| 72. | 23059 | 12.5% | 7.9%(+4.55)#72 | 7.6%(+4.84)#2,646 |
| 73. | 24649 | 12.4% | 7.9%(+4.43)#73 | 7.6%(+4.72)#2,702 |
| 74. | 23508 | 12.4% | 7.9%(+4.42)#74 | 7.6%(+4.71)#2,704 |
| 75. | 24120 | 12.3% | 7.9%(+4.38)#75 | 7.6%(+4.68)#2,732 |
| 76. | 23071 | 12.3% | 7.9%(+4.35)#76 | 7.6%(+4.64)#2,756 |
| 77. | 22033 | 12.1% | 7.9%(+4.17)#77 | 7.6%(+4.46)#2,842 |
| 78. | 24121 | 12.0% | 7.9%(+4.03)#78 | 7.6%(+4.32)#2,909 |
| 79. | 22125 | 11.9% | 7.9%(+3.94)#79 | 7.6%(+4.23)#2,961 |
| 80. | 23025 | 11.8% | 7.9%(+3.89)#80 | 7.6%(+4.19)#2,981 |
| 81. | 20120 | 11.6% | 7.9%(+3.65)#81 | 7.6%(+3.94)#3,116 |
| 82. | 24324 | 11.6% | 7.9%(+3.64)#82 | 7.6%(+3.93)#3,122 |
| 83. | 20158 | 11.6% | 7.9%(+3.61)#83 | 7.6%(+3.90)#3,137 |
| 84. | 23922 | 11.5% | 7.9%(+3.59)#84 | 7.6%(+3.88)#3,150 |
| 85. | 22030 | 11.5% | 7.9%(+3.56)#85 | 7.6%(+3.86)#3,171 |
| 86. | 24579 | 11.5% | 7.9%(+3.55)#86 | 7.6%(+3.85)#3,178 |
| 87. | 20105 | 11.5% | 7.9%(+3.52)#87 | 7.6%(+3.81)#3,204 |
| 88. | 20155 | 11.4% | 7.9%(+3.49)#88 | 7.6%(+3.78)#3,222 |
| 89. | 23693 | 11.4% | 7.9%(+3.48)#89 | 7.6%(+3.78)#3,233 |
| 90. | 22124 | 11.4% | 7.9%(+3.48)#90 | 7.6%(+3.77)#3,235 |
| 91. | 24574 | 11.4% | 7.9%(+3.44)#91 | 7.6%(+3.73)#3,268 |
| 92. | 22904 | 11.4% | 7.9%(+3.43)#92 | 7.6%(+3.73)#3,273 |
| 93. | 24290 | 11.3% | 7.9%(+3.40)#93 | 7.6%(+3.69)#3,294 |
| 94. | 22310 | 11.3% | 7.9%(+3.39)#94 | 7.6%(+3.68)#3,298 |
| 95. | 23438 | 11.3% | 7.9%(+3.39)#95 | 7.6%(+3.68)#3,303 |
| 96. | 20164 | 11.3% | 7.9%(+3.33)#96 | 7.6%(+3.62)#3,352 |
| 97. | 24011 | 11.3% | 7.9%(+3.32)#97 | 7.6%(+3.62)#3,353 |
| 98. | 23356 | 11.2% | 7.9%(+3.27)#98 | 7.6%(+3.57)#3,389 |
| 99. | 23336 | 11.2% | 7.9%(+3.25)#99 | 7.6%(+3.54)#3,414 |
| 100. | 23138 | 11.1% | 7.9%(+3.17)#100 | 7.6%(+3.46)#3,464 |
Common Questions
What are the Top 10 Zip Codes with the Highest Percentage of Population with a Degree in Engineering in Virginia?
Top 10 Zip Codes with the Highest Percentage of Population with a Degree in Engineering in Virginia are:
What zip code has the Highest Percentage of Population with a Degree in Engineering in Virginia?
22845 has the Highest Percentage of Population with a Degree in Engineering in Virginia with 100.0%.
What is the Percentage of Population with a Degree in Engineering in the State of Virginia?
Percentage of Population with a Degree in Engineering in Virginia is 7.9%.
What is the Percentage of Population with a Degree in Engineering in the United States?
Percentage of Population with a Degree in Engineering in the United States is 7.6%.