Zip Codes with the Highest Percentage of Population with a Degree in Engineering in Maryland
RELATED REPORTS & OPTIONS
Engineering
Maryland
Compare Zip Codes
Map of Zip Codes with the Highest Percentage of Population with a Degree in Engineering in Maryland
0.0%
50.0%
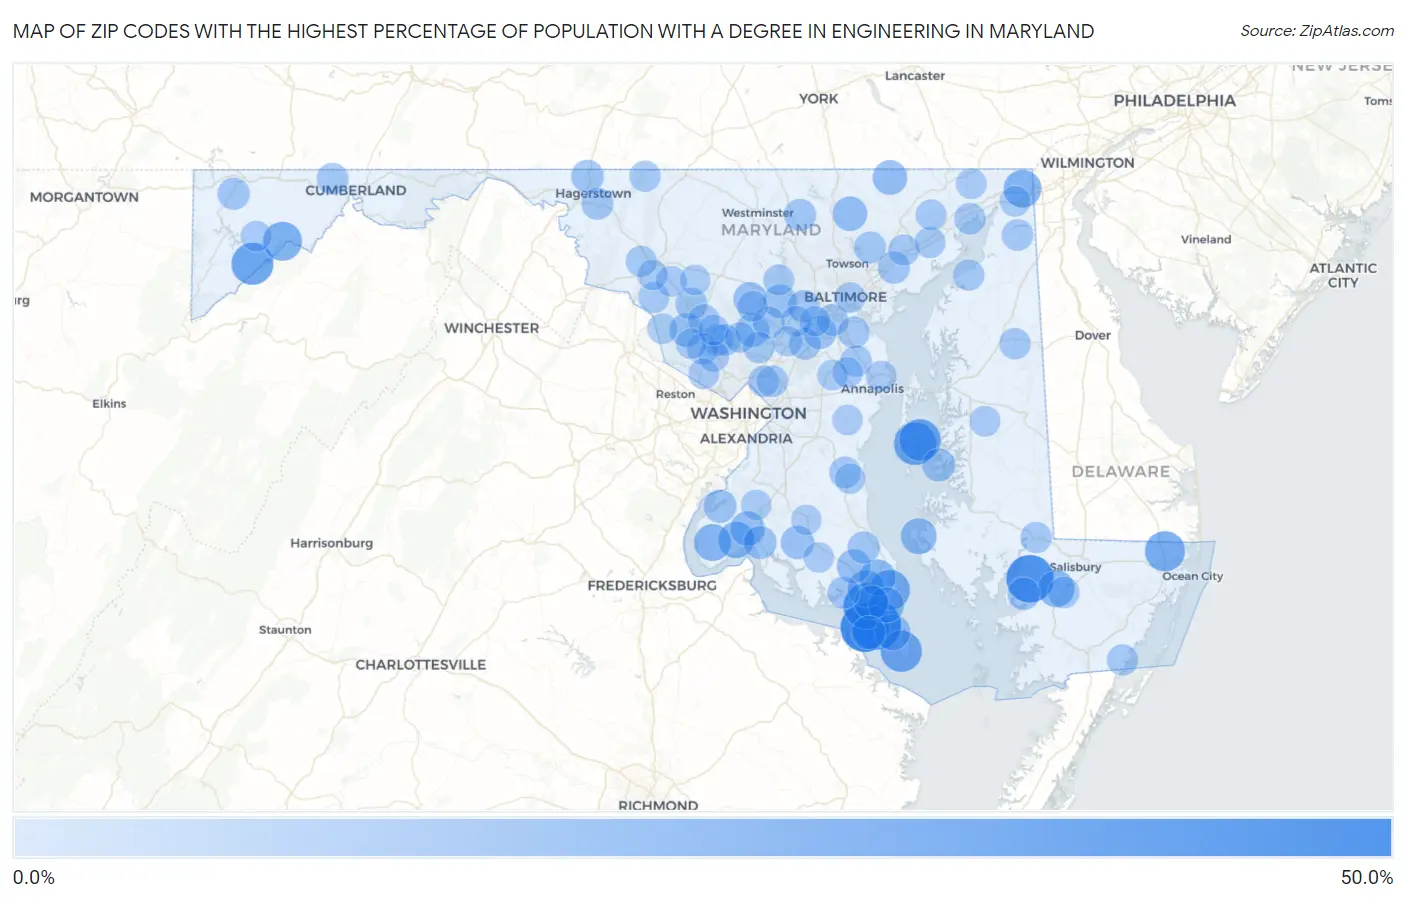
Zip Codes with the Highest Percentage of Population with a Degree in Engineering in Maryland
| Zip Code | % Graduates | vs State | vs National | |
| 1. | 20630 | 43.9% | 7.7% (+36.2)#1 | 7.6% (+36.2)#183 |
| 2. | 20690 | 42.9% | 7.7% (+35.2)#2 | 7.6% (+35.2)#187 |
| 3. | 21856 | 40.0% | 7.7% (+32.3)#3 | 7.6% (+32.4)#214 |
| 4. | 20620 | 37.1% | 7.7% (+29.5)#4 | 7.6% (+29.5)#250 |
| 5. | 21676 | 31.2% | 7.7% (+23.6)#5 | 7.6% (+23.6)#349 |
| 6. | 21538 | 30.3% | 7.7% (+22.6)#6 | 7.6% (+22.7)#367 |
| 7. | 21647 | 29.8% | 7.7% (+22.1)#7 | 7.6% (+22.2)#373 |
| 8. | 20687 | 29.1% | 7.7% (+21.5)#8 | 7.6% (+21.5)#385 |
| 9. | 21813 | 27.0% | 7.7% (+19.3)#9 | 7.6% (+19.3)#461 |
| 10. | 20670 | 26.8% | 7.7% (+19.1)#10 | 7.6% (+19.1)#474 |
| 11. | 21523 | 25.0% | 7.7% (+17.3)#11 | 7.6% (+17.4)#561 |
| 12. | 21920 | 22.8% | 7.7% (+15.1)#12 | 7.6% (+15.1)#663 |
| 13. | 20619 | 21.3% | 7.7% (+13.6)#13 | 7.6% (+13.6)#786 |
| 14. | 20662 | 21.1% | 7.7% (+13.5)#14 | 7.6% (+13.5)#803 |
| 15. | 21810 | 21.0% | 7.7% (+13.3)#15 | 7.6% (+13.3)#813 |
| 16. | 20693 | 20.4% | 7.7% (+12.7)#16 | 7.6% (+12.8)#866 |
| 17. | 20688 | 20.1% | 7.7% (+12.4)#17 | 7.6% (+12.4)#901 |
| 18. | 21669 | 19.4% | 7.7% (+11.7)#18 | 7.6% (+11.7)#987 |
| 19. | 20684 | 19.1% | 7.7% (+11.4)#19 | 7.6% (+11.4)#1,012 |
| 20. | 20653 | 18.8% | 7.7% (+11.1)#20 | 7.6% (+11.1)#1,059 |
| 21. | 20677 | 17.3% | 7.7% (+9.68)#21 | 7.6% (+9.69)#1,251 |
| 22. | 21132 | 17.2% | 7.7% (+9.58)#22 | 7.6% (+9.59)#1,267 |
| 23. | 21111 | 17.0% | 7.7% (+9.34)#23 | 7.6% (+9.36)#1,320 |
| 24. | 20634 | 16.5% | 7.7% (+8.84)#24 | 7.6% (+8.86)#1,399 |
| 25. | 20636 | 16.0% | 7.7% (+8.34)#25 | 7.6% (+8.35)#1,492 |
| 26. | 20674 | 15.5% | 7.7% (+7.82)#26 | 7.6% (+7.84)#1,619 |
| 27. | 20862 | 15.4% | 7.7% (+7.72)#27 | 7.6% (+7.74)#1,654 |
| 28. | 21042 | 15.3% | 7.7% (+7.65)#28 | 7.6% (+7.66)#1,673 |
| 29. | 20622 | 15.2% | 7.7% (+7.58)#29 | 7.6% (+7.60)#1,690 |
| 30. | 20841 | 15.1% | 7.7% (+7.44)#30 | 7.6% (+7.45)#1,721 |
| 31. | 21738 | 15.0% | 7.7% (+7.38)#31 | 7.6% (+7.39)#1,739 |
| 32. | 20611 | 14.8% | 7.7% (+7.10)#32 | 7.6% (+7.12)#1,810 |
| 33. | 21662 | 14.6% | 7.7% (+6.97)#33 | 7.6% (+6.99)#1,833 |
| 34. | 20658 | 14.4% | 7.7% (+6.72)#34 | 7.6% (+6.74)#1,900 |
| 35. | 21076 | 14.4% | 7.7% (+6.71)#35 | 7.6% (+6.72)#1,907 |
| 36. | 21767 | 13.9% | 7.7% (+6.23)#36 | 7.6% (+6.24)#2,061 |
| 37. | 21865 | 13.5% | 7.7% (+5.85)#37 | 7.6% (+5.87)#2,209 |
| 38. | 21162 | 13.3% | 7.7% (+5.62)#38 | 7.6% (+5.64)#2,308 |
| 39. | 20685 | 13.1% | 7.7% (+5.40)#39 | 7.6% (+5.41)#2,382 |
| 40. | 21520 | 13.1% | 7.7% (+5.39)#40 | 7.6% (+5.41)#2,383 |
| 41. | 21043 | 13.0% | 7.7% (+5.31)#41 | 7.6% (+5.33)#2,417 |
| 42. | 21155 | 12.9% | 7.7% (+5.25)#42 | 7.6% (+5.26)#2,441 |
| 43. | 20650 | 12.9% | 7.7% (+5.22)#43 | 7.6% (+5.24)#2,457 |
| 44. | 20871 | 12.8% | 7.7% (+5.14)#44 | 7.6% (+5.15)#2,494 |
| 45. | 21057 | 12.7% | 7.7% (+5.06)#45 | 7.6% (+5.07)#2,528 |
| 46. | 21734 | 12.6% | 7.7% (+4.95)#46 | 7.6% (+4.96)#2,576 |
| 47. | 21029 | 12.6% | 7.7% (+4.94)#47 | 7.6% (+4.96)#2,577 |
| 48. | 20701 | 12.5% | 7.7% (+4.88)#48 | 7.6% (+4.89)#2,599 |
| 49. | 21090 | 12.3% | 7.7% (+4.63)#49 | 7.6% (+4.64)#2,758 |
| 50. | 21545 | 12.1% | 7.7% (+4.44)#50 | 7.6% (+4.46)#2,843 |
| 51. | 21915 | 12.0% | 7.7% (+4.36)#51 | 7.6% (+4.38)#2,881 |
| 52. | 21822 | 12.0% | 7.7% (+4.35)#52 | 7.6% (+4.37)#2,884 |
| 53. | 20736 | 12.0% | 7.7% (+4.30)#53 | 7.6% (+4.32)#2,912 |
| 54. | 21060 | 11.9% | 7.7% (+4.27)#54 | 7.6% (+4.29)#2,927 |
| 55. | 21902 | 11.9% | 7.7% (+4.24)#55 | 7.6% (+4.26)#2,944 |
| 56. | 20880 | 11.9% | 7.7% (+4.22)#56 | 7.6% (+4.23)#2,962 |
| 57. | 20740 | 11.8% | 7.7% (+4.14)#57 | 7.6% (+4.16)#2,994 |
| 58. | 21146 | 11.7% | 7.7% (+4.03)#58 | 7.6% (+4.05)#3,052 |
| 59. | 20876 | 11.6% | 7.7% (+3.97)#59 | 7.6% (+3.99)#3,083 |
| 60. | 20905 | 11.6% | 7.7% (+3.95)#60 | 7.6% (+3.97)#3,100 |
| 61. | 20855 | 11.6% | 7.7% (+3.92)#61 | 7.6% (+3.94)#3,120 |
| 62. | 21607 | 11.5% | 7.7% (+3.88)#62 | 7.6% (+3.89)#3,144 |
| 63. | 21864 | 11.4% | 7.7% (+3.70)#63 | 7.6% (+3.72)#3,278 |
| 64. | 21719 | 11.3% | 7.7% (+3.68)#64 | 7.6% (+3.70)#3,290 |
| 65. | 21610 | 11.3% | 7.7% (+3.66)#65 | 7.6% (+3.67)#3,310 |
| 66. | 21837 | 11.3% | 7.7% (+3.64)#66 | 7.6% (+3.65)#3,330 |
| 67. | 20878 | 11.2% | 7.7% (+3.57)#67 | 7.6% (+3.59)#3,375 |
| 68. | 20783 | 11.1% | 7.7% (+3.45)#68 | 7.6% (+3.47)#3,452 |
| 69. | 21085 | 11.1% | 7.7% (+3.43)#69 | 7.6% (+3.45)#3,501 |
| 70. | 21017 | 10.9% | 7.7% (+3.28)#70 | 7.6% (+3.30)#3,585 |
| 71. | 21104 | 10.9% | 7.7% (+3.26)#71 | 7.6% (+3.28)#3,596 |
| 72. | 21028 | 10.9% | 7.7% (+3.21)#72 | 7.6% (+3.22)#3,631 |
| 73. | 21714 | 10.8% | 7.7% (+3.18)#73 | 7.6% (+3.20)#3,661 |
| 74. | 21710 | 10.8% | 7.7% (+3.12)#74 | 7.6% (+3.14)#3,712 |
| 75. | 21561 | 10.7% | 7.7% (+3.04)#75 | 7.6% (+3.05)#3,783 |
| 76. | 21704 | 10.6% | 7.7% (+2.97)#76 | 7.6% (+2.98)#3,846 |
| 77. | 20850 | 10.6% | 7.7% (+2.96)#77 | 7.6% (+2.97)#3,859 |
| 78. | 20874 | 10.5% | 7.7% (+2.82)#78 | 7.6% (+2.84)#3,992 |
| 79. | 21045 | 10.5% | 7.7% (+2.82)#79 | 7.6% (+2.84)#3,993 |
| 80. | 20886 | 10.5% | 7.7% (+2.81)#80 | 7.6% (+2.83)#4,000 |
| 81. | 21409 | 10.4% | 7.7% (+2.76)#81 | 7.6% (+2.78)#4,055 |
| 82. | 21625 | 10.4% | 7.7% (+2.72)#82 | 7.6% (+2.74)#4,097 |
| 83. | 21054 | 10.4% | 7.7% (+2.70)#83 | 7.6% (+2.72)#4,117 |
| 84. | 21231 | 10.4% | 7.7% (+2.69)#84 | 7.6% (+2.71)#4,122 |
| 85. | 21911 | 10.3% | 7.7% (+2.67)#85 | 7.6% (+2.69)#4,144 |
| 86. | 21737 | 10.3% | 7.7% (+2.67)#86 | 7.6% (+2.69)#4,146 |
| 87. | 21921 | 10.3% | 7.7% (+2.64)#87 | 7.6% (+2.65)#4,169 |
| 88. | 20854 | 10.3% | 7.7% (+2.63)#88 | 7.6% (+2.65)#4,177 |
| 89. | 20675 | 10.2% | 7.7% (+2.50)#89 | 7.6% (+2.51)#4,303 |
| 90. | 21032 | 10.1% | 7.7% (+2.47)#90 | 7.6% (+2.48)#4,328 |
| 91. | 20839 | 10.1% | 7.7% (+2.45)#91 | 7.6% (+2.46)#4,343 |
| 92. | 21703 | 10.1% | 7.7% (+2.43)#92 | 7.6% (+2.44)#4,361 |
| 93. | 20776 | 10.1% | 7.7% (+2.42)#93 | 7.6% (+2.43)#4,373 |
| 94. | 21770 | 10.1% | 7.7% (+2.40)#94 | 7.6% (+2.42)#4,384 |
| 95. | 20637 | 10.0% | 7.7% (+2.31)#95 | 7.6% (+2.33)#4,479 |
| 96. | 20832 | 9.9% | 7.7% (+2.25)#96 | 7.6% (+2.27)#4,517 |
| 97. | 21075 | 9.9% | 7.7% (+2.25)#97 | 7.6% (+2.26)#4,520 |
| 98. | 20689 | 9.8% | 7.7% (+2.17)#98 | 7.6% (+2.19)#4,586 |
| 99. | 20723 | 9.7% | 7.7% (+2.09)#99 | 7.6% (+2.10)#4,684 |
| 100. | 20659 | 9.7% | 7.7% (+2.08)#100 | 7.6% (+2.10)#4,694 |
Common Questions
What are the Top 10 Zip Codes with the Highest Percentage of Population with a Degree in Engineering in Maryland?
Top 10 Zip Codes with the Highest Percentage of Population with a Degree in Engineering in Maryland are:
What zip code has the Highest Percentage of Population with a Degree in Engineering in Maryland?
20630 has the Highest Percentage of Population with a Degree in Engineering in Maryland with 43.9%.
What is the Percentage of Population with a Degree in Engineering in the State of Maryland?
Percentage of Population with a Degree in Engineering in Maryland is 7.7%.
What is the Percentage of Population with a Degree in Engineering in the United States?
Percentage of Population with a Degree in Engineering in the United States is 7.6%.