Zip Codes with the Highest Percentage of Population with a Degree in Engineering in Massachusetts
RELATED REPORTS & OPTIONS
Engineering
Massachusetts
Compare Zip Codes
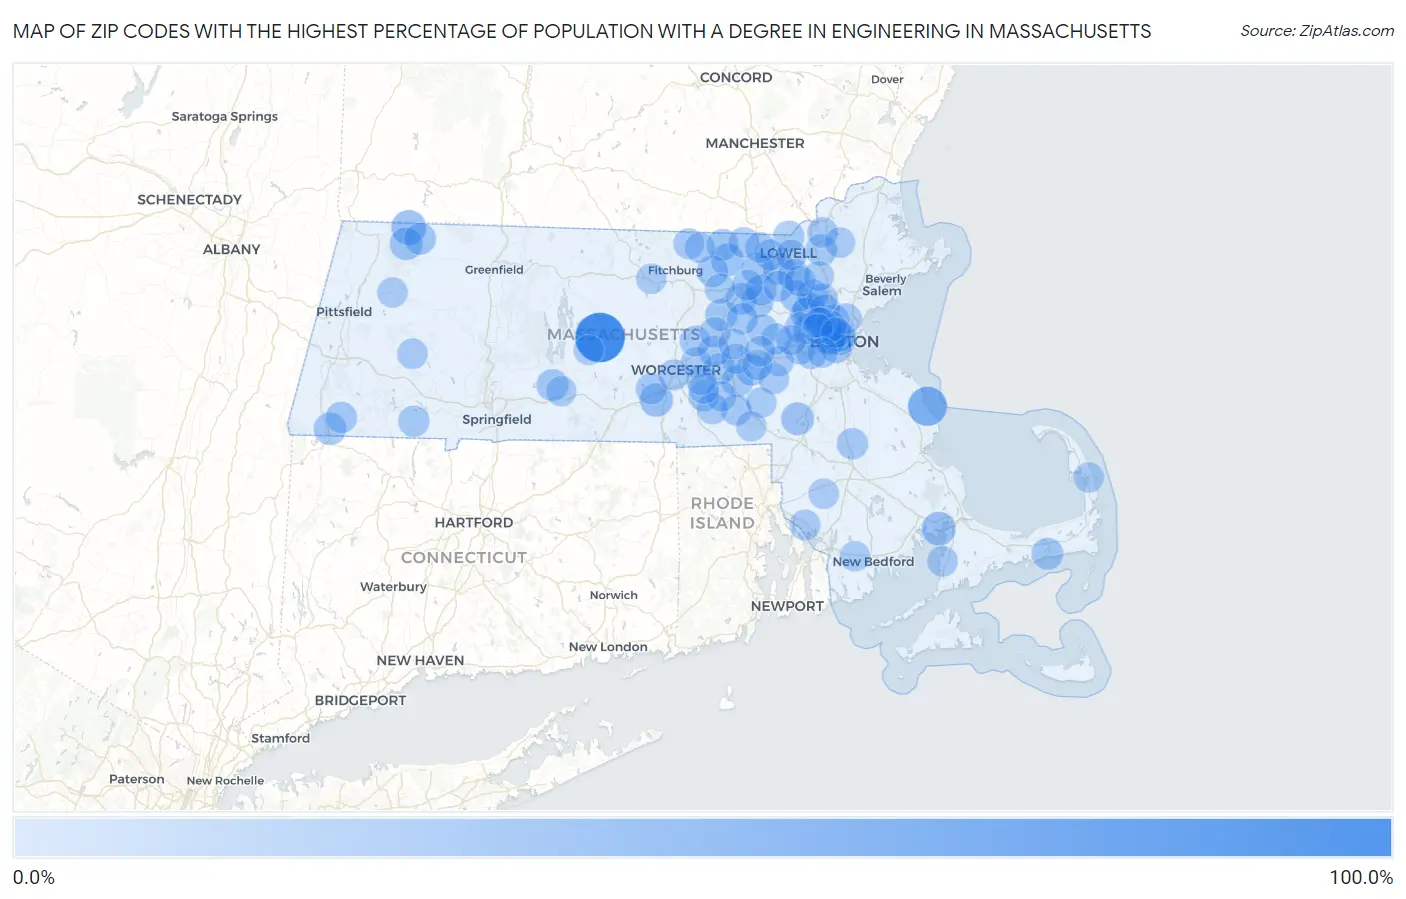
Map of Zip Codes with the Highest Percentage of Population with a Degree in Engineering in Massachusetts
0.0%
100.0%
Zip Codes with the Highest Percentage of Population with a Degree in Engineering in Massachusetts
| Zip Code | % Graduates | vs State | vs National | |
| 1. | 01094 | 100.0% | 8.7%(+91.3)#1 | 7.6%(+92.4)#42 |
| 2. | 02047 | 50.9% | 8.7%(+42.1)#2 | 7.6%(+43.2)#126 |
| 3. | 01350 | 30.8% | 8.7%(+22.0)#3 | 7.6%(+23.1)#357 |
| 4. | 02558 | 26.4% | 8.7%(+17.7)#4 | 7.6%(+18.8)#482 |
| 5. | 01537 | 24.4% | 8.7%(+15.7)#5 | 7.6%(+16.8)#580 |
| 6. | 01450 | 22.7% | 8.7%(+14.0)#6 | 7.6%(+15.1)#667 |
| 7. | 02071 | 21.9% | 8.7%(+13.2)#7 | 7.6%(+14.2)#724 |
| 8. | 01343 | 21.4% | 8.7%(+12.7)#8 | 7.6%(+13.8)#777 |
| 9. | 01222 | 20.4% | 8.7%(+11.6)#9 | 7.6%(+12.7)#875 |
| 10. | 02163 | 20.3% | 8.7%(+11.6)#10 | 7.6%(+12.7)#879 |
| 11. | 01720 | 19.7% | 8.7%(+11.0)#11 | 7.6%(+12.1)#945 |
| 12. | 01886 | 18.9% | 8.7%(+10.2)#12 | 7.6%(+11.3)#1,044 |
| 13. | 02142 | 18.5% | 8.7%(+9.77)#13 | 7.6%(+10.8)#1,096 |
| 14. | 01740 | 18.4% | 8.7%(+9.65)#14 | 7.6%(+10.7)#1,115 |
| 15. | 01824 | 18.2% | 8.7%(+9.49)#15 | 7.6%(+10.6)#1,132 |
| 16. | 01009 | 18.1% | 8.7%(+9.37)#16 | 7.6%(+10.4)#1,151 |
| 17. | 01367 | 17.7% | 8.7%(+8.98)#17 | 7.6%(+10.1)#1,196 |
| 18. | 01730 | 17.7% | 8.7%(+8.97)#18 | 7.6%(+10.0)#1,197 |
| 19. | 02420 | 17.6% | 8.7%(+8.92)#19 | 7.6%(+9.99)#1,205 |
| 20. | 01862 | 17.6% | 8.7%(+8.87)#20 | 7.6%(+9.94)#1,209 |
| 21. | 01463 | 17.4% | 8.7%(+8.73)#21 | 7.6%(+9.80)#1,229 |
| 22. | 01719 | 17.3% | 8.7%(+8.56)#22 | 7.6%(+9.63)#1,261 |
| 23. | 02670 | 17.2% | 8.7%(+8.50)#23 | 7.6%(+9.57)#1,274 |
| 24. | 02421 | 17.2% | 8.7%(+8.46)#24 | 7.6%(+9.53)#1,285 |
| 25. | 01810 | 16.6% | 8.7%(+7.88)#25 | 7.6%(+8.95)#1,389 |
| 26. | 01464 | 16.4% | 8.7%(+7.72)#26 | 7.6%(+8.80)#1,412 |
| 27. | 01776 | 16.0% | 8.7%(+7.27)#27 | 7.6%(+8.34)#1,498 |
| 28. | 01748 | 15.9% | 8.7%(+7.19)#28 | 7.6%(+8.27)#1,517 |
| 29. | 01581 | 15.8% | 8.7%(+7.11)#29 | 7.6%(+8.18)#1,533 |
| 30. | 01721 | 15.8% | 8.7%(+7.10)#30 | 7.6%(+8.17)#1,537 |
| 31. | 01244 | 15.8% | 8.7%(+7.07)#31 | 7.6%(+8.14)#1,548 |
| 32. | 01775 | 15.5% | 8.7%(+6.74)#32 | 7.6%(+7.81)#1,625 |
| 33. | 02120 | 15.4% | 8.7%(+6.73)#33 | 7.6%(+7.80)#1,631 |
| 34. | 02141 | 15.1% | 8.7%(+6.40)#34 | 7.6%(+7.47)#1,717 |
| 35. | 02379 | 15.0% | 8.7%(+6.33)#35 | 7.6%(+7.40)#1,736 |
| 36. | 01826 | 14.6% | 8.7%(+5.87)#36 | 7.6%(+6.94)#1,845 |
| 37. | 02462 | 14.6% | 8.7%(+5.85)#37 | 7.6%(+6.93)#1,848 |
| 38. | 01034 | 14.5% | 8.7%(+5.79)#38 | 7.6%(+6.87)#1,864 |
| 39. | 01718 | 14.5% | 8.7%(+5.79)#39 | 7.6%(+6.86)#1,865 |
| 40. | 01803 | 14.4% | 8.7%(+5.71)#40 | 7.6%(+6.78)#1,883 |
| 41. | 02155 | 14.4% | 8.7%(+5.70)#41 | 7.6%(+6.77)#1,887 |
| 42. | 01542 | 14.1% | 8.7%(+5.39)#42 | 7.6%(+6.46)#1,988 |
| 43. | 01747 | 14.1% | 8.7%(+5.35)#43 | 7.6%(+6.43)#1,991 |
| 44. | 01863 | 14.0% | 8.7%(+5.24)#44 | 7.6%(+6.31)#2,028 |
| 45. | 01460 | 13.8% | 8.7%(+5.11)#45 | 7.6%(+6.19)#2,086 |
| 46. | 01532 | 13.7% | 8.7%(+4.95)#46 | 7.6%(+6.02)#2,147 |
| 47. | 01890 | 13.6% | 8.7%(+4.89)#47 | 7.6%(+5.96)#2,168 |
| 48. | 01534 | 13.5% | 8.7%(+4.81)#48 | 7.6%(+5.89)#2,200 |
| 49. | 01778 | 13.4% | 8.7%(+4.64)#49 | 7.6%(+5.71)#2,268 |
| 50. | 02134 | 13.3% | 8.7%(+4.54)#50 | 7.6%(+5.61)#2,320 |
| 51. | 01610 | 13.1% | 8.7%(+4.37)#51 | 7.6%(+5.44)#2,369 |
| 52. | 01827 | 13.0% | 8.7%(+4.28)#52 | 7.6%(+5.35)#2,405 |
| 53. | 01741 | 13.0% | 8.7%(+4.28)#53 | 7.6%(+5.35)#2,406 |
| 54. | 02452 | 13.0% | 8.7%(+4.27)#54 | 7.6%(+5.34)#2,408 |
| 55. | 01545 | 13.0% | 8.7%(+4.27)#55 | 7.6%(+5.34)#2,410 |
| 56. | 01560 | 13.0% | 8.7%(+4.27)#56 | 7.6%(+5.34)#2,412 |
| 57. | 02777 | 12.9% | 8.7%(+4.22)#57 | 7.6%(+5.29)#2,429 |
| 58. | 01474 | 12.9% | 8.7%(+4.18)#58 | 7.6%(+5.26)#2,445 |
| 59. | 01505 | 12.7% | 8.7%(+4.00)#59 | 7.6%(+5.07)#2,529 |
| 60. | 02148 | 12.7% | 8.7%(+3.98)#60 | 7.6%(+5.05)#2,536 |
| 61. | 01821 | 12.6% | 8.7%(+3.85)#61 | 7.6%(+4.92)#2,589 |
| 62. | 01770 | 12.5% | 8.7%(+3.79)#62 | 7.6%(+4.87)#2,616 |
| 63. | 02451 | 12.5% | 8.7%(+3.79)#63 | 7.6%(+4.86)#2,618 |
| 64. | 02140 | 12.4% | 8.7%(+3.72)#64 | 7.6%(+4.79)#2,658 |
| 65. | 02556 | 12.4% | 8.7%(+3.68)#65 | 7.6%(+4.75)#2,681 |
| 66. | 02144 | 12.4% | 8.7%(+3.68)#66 | 7.6%(+4.75)#2,682 |
| 67. | 01801 | 12.3% | 8.7%(+3.61)#67 | 7.6%(+4.69)#2,722 |
| 68. | 01503 | 12.3% | 8.7%(+3.58)#68 | 7.6%(+4.65)#2,751 |
| 69. | 02461 | 12.2% | 8.7%(+3.48)#69 | 7.6%(+4.55)#2,799 |
| 70. | 01852 | 12.1% | 8.7%(+3.36)#70 | 7.6%(+4.44)#2,853 |
| 71. | 01840 | 12.0% | 8.7%(+3.32)#71 | 7.6%(+4.39)#2,875 |
| 72. | 01011 | 12.0% | 8.7%(+3.28)#72 | 7.6%(+4.35)#2,894 |
| 73. | 01879 | 12.0% | 8.7%(+3.26)#73 | 7.6%(+4.33)#2,906 |
| 74. | 01568 | 12.0% | 8.7%(+3.25)#74 | 7.6%(+4.32)#2,908 |
| 75. | 02474 | 11.9% | 8.7%(+3.15)#75 | 7.6%(+4.23)#2,965 |
| 76. | 01469 | 11.9% | 8.7%(+3.14)#76 | 7.6%(+4.21)#2,971 |
| 77. | 01752 | 11.8% | 8.7%(+3.08)#77 | 7.6%(+4.15)#2,995 |
| 78. | 01760 | 11.5% | 8.7%(+2.80)#78 | 7.6%(+3.87)#3,153 |
| 79. | 01519 | 11.5% | 8.7%(+2.80)#79 | 7.6%(+3.87)#3,159 |
| 80. | 02476 | 11.5% | 8.7%(+2.75)#80 | 7.6%(+3.82)#3,198 |
| 81. | 01270 | 11.5% | 8.7%(+2.74)#81 | 7.6%(+3.81)#3,208 |
| 82. | 01772 | 11.4% | 8.7%(+2.73)#82 | 7.6%(+3.80)#3,213 |
| 83. | 02053 | 11.4% | 8.7%(+2.66)#83 | 7.6%(+3.73)#3,272 |
| 84. | 02764 | 11.3% | 8.7%(+2.61)#84 | 7.6%(+3.68)#3,300 |
| 85. | 02019 | 11.2% | 8.7%(+2.52)#85 | 7.6%(+3.59)#3,367 |
| 86. | 01702 | 11.2% | 8.7%(+2.50)#86 | 7.6%(+3.57)#3,381 |
| 87. | 01473 | 11.2% | 8.7%(+2.50)#87 | 7.6%(+3.57)#3,387 |
| 88. | 01701 | 11.2% | 8.7%(+2.48)#88 | 7.6%(+3.56)#3,405 |
| 89. | 01536 | 11.2% | 8.7%(+2.46)#89 | 7.6%(+3.54)#3,416 |
| 90. | 02663 | 11.2% | 8.7%(+2.45)#90 | 7.6%(+3.52)#3,423 |
| 91. | 02478 | 11.1% | 8.7%(+2.39)#91 | 7.6%(+3.46)#3,453 |
| 92. | 01845 | 11.1% | 8.7%(+2.39)#92 | 7.6%(+3.46)#3,495 |
| 93. | 02493 | 11.0% | 8.7%(+2.32)#93 | 7.6%(+3.39)#3,535 |
| 94. | 01069 | 10.9% | 8.7%(+2.20)#94 | 7.6%(+3.28)#3,600 |
| 95. | 02747 | 10.9% | 8.7%(+2.20)#95 | 7.6%(+3.27)#3,608 |
| 96. | 02143 | 10.9% | 8.7%(+2.15)#96 | 7.6%(+3.22)#3,640 |
| 97. | 01434 | 10.8% | 8.7%(+2.13)#97 | 7.6%(+3.20)#3,657 |
| 98. | 01887 | 10.8% | 8.7%(+2.10)#98 | 7.6%(+3.18)#3,684 |
| 99. | 02467 | 10.8% | 8.7%(+2.03)#99 | 7.6%(+3.10)#3,734 |
| 100. | 01031 | 10.7% | 8.7%(+2.02)#100 | 7.6%(+3.09)#3,743 |
Common Questions
What are the Top 10 Zip Codes with the Highest Percentage of Population with a Degree in Engineering in Massachusetts?
Top 10 Zip Codes with the Highest Percentage of Population with a Degree in Engineering in Massachusetts are:
What zip code has the Highest Percentage of Population with a Degree in Engineering in Massachusetts?
01094 has the Highest Percentage of Population with a Degree in Engineering in Massachusetts with 100.0%.
What is the Percentage of Population with a Degree in Engineering in the State of Massachusetts?
Percentage of Population with a Degree in Engineering in Massachusetts is 8.7%.
What is the Percentage of Population with a Degree in Engineering in the United States?
Percentage of Population with a Degree in Engineering in the United States is 7.6%.