Zip Codes with the Highest Percentage of Households with Income Below $10,000 in Georgia
RELATED REPORTS & OPTIONS
Household Income | $0-10k
Georgia
Compare Zip Codes
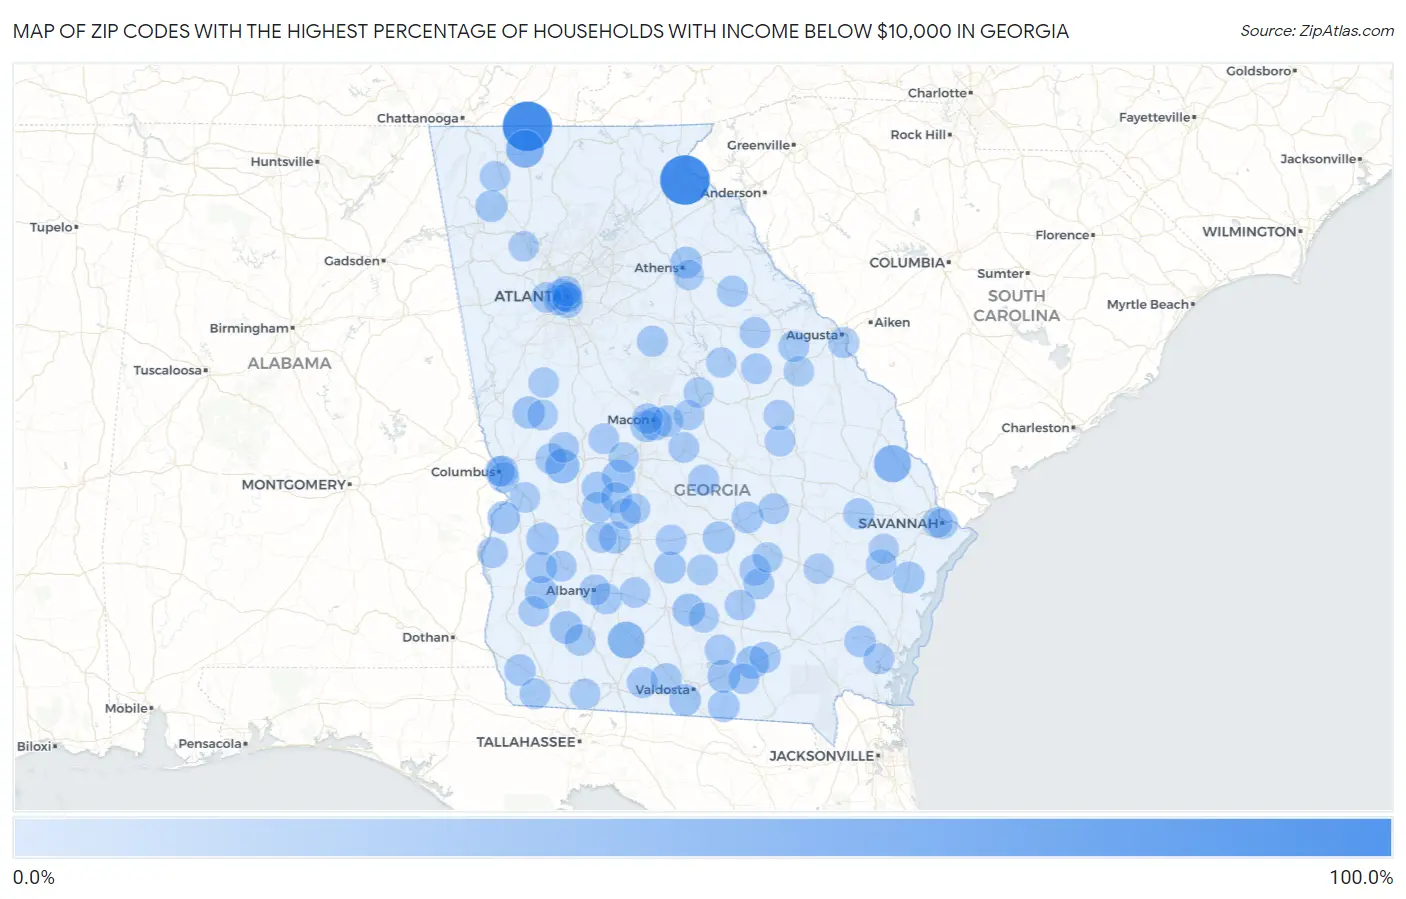
Map of Zip Codes with the Highest Percentage of Households with Income Below $10,000 in Georgia
0.0%
100.0%
Zip Codes with the Highest Percentage of Households with Income Below $10,000 in Georgia
| Zip Code | Households with Income < $10k | vs State | vs National | |
| 1. | 30751 | 100.0% | 5.4%(+94.6)#1 | 4.9%(+95.1)#13 |
| 2. | 30598 | 100.0% | 5.4%(+94.6)#2 | 4.9%(+95.1)#16 |
| 3. | 30724 | 45.5% | 5.4%(+40.1)#3 | 4.9%(+40.6)#136 |
| 4. | 30449 | 41.7% | 5.4%(+36.3)#4 | 4.9%(+36.8)#160 |
| 5. | 31753 | 40.0% | 5.4%(+34.6)#5 | 4.9%(+35.1)#174 |
| 6. | 31058 | 28.1% | 5.4%(+22.7)#6 | 4.9%(+23.2)#369 |
| 7. | 31201 | 24.4% | 5.4%(+19.0)#7 | 4.9%(+19.5)#514 |
| 8. | 31057 | 24.0% | 5.4%(+18.6)#8 | 4.9%(+19.1)#530 |
| 9. | 31634 | 22.3% | 5.4%(+16.9)#9 | 4.9%(+17.4)#617 |
| 10. | 39870 | 22.2% | 5.4%(+16.8)#10 | 4.9%(+17.3)#623 |
| 11. | 31749 | 21.5% | 5.4%(+16.1)#11 | 4.9%(+16.6)#669 |
| 12. | 31649 | 21.5% | 5.4%(+16.1)#12 | 4.9%(+16.6)#672 |
| 13. | 39866 | 21.2% | 5.4%(+15.8)#13 | 4.9%(+16.3)#692 |
| 14. | 31821 | 20.8% | 5.4%(+15.4)#14 | 4.9%(+15.9)#723 |
| 15. | 31832 | 20.7% | 5.4%(+15.3)#15 | 4.9%(+15.8)#735 |
| 16. | 31830 | 19.9% | 5.4%(+14.5)#16 | 4.9%(+15.0)#806 |
| 17. | 31060 | 18.8% | 5.4%(+13.4)#17 | 4.9%(+13.9)#919 |
| 18. | 31735 | 18.1% | 5.4%(+12.7)#18 | 4.9%(+13.2)#1,015 |
| 19. | 31783 | 18.0% | 5.4%(+12.6)#19 | 4.9%(+13.1)#1,025 |
| 20. | 30314 | 17.8% | 5.4%(+12.4)#20 | 4.9%(+12.9)#1,043 |
| 21. | 30733 | 17.7% | 5.4%(+12.3)#21 | 4.9%(+12.8)#1,058 |
| 22. | 30601 | 17.6% | 5.4%(+12.2)#22 | 4.9%(+12.7)#1,067 |
| 23. | 31323 | 17.6% | 5.4%(+12.2)#23 | 4.9%(+12.7)#1,073 |
| 24. | 31601 | 17.5% | 5.4%(+12.1)#24 | 4.9%(+12.6)#1,087 |
| 25. | 30411 | 16.7% | 5.4%(+11.3)#25 | 4.9%(+11.8)#1,202 |
| 26. | 39886 | 16.7% | 5.4%(+11.3)#26 | 4.9%(+11.8)#1,207 |
| 27. | 31648 | 16.7% | 5.4%(+11.3)#27 | 4.9%(+11.8)#1,211 |
| 28. | 31217 | 16.6% | 5.4%(+11.2)#28 | 4.9%(+11.7)#1,231 |
| 29. | 31068 | 16.6% | 5.4%(+11.2)#29 | 4.9%(+11.7)#1,233 |
| 30. | 31206 | 16.3% | 5.4%(+10.9)#30 | 4.9%(+11.4)#1,280 |
| 31. | 31566 | 16.2% | 5.4%(+10.8)#31 | 4.9%(+11.3)#1,296 |
| 32. | 31711 | 15.8% | 5.4%(+10.4)#32 | 4.9%(+10.9)#1,384 |
| 33. | 39859 | 15.6% | 5.4%(+10.2)#33 | 4.9%(+10.7)#1,417 |
| 34. | 31623 | 15.4% | 5.4%(+10.00)#34 | 4.9%(+10.5)#1,448 |
| 35. | 31906 | 15.0% | 5.4%(+9.60)#35 | 4.9%(+10.1)#1,517 |
| 36. | 30315 | 14.9% | 5.4%(+9.50)#36 | 4.9%(+10.00)#1,538 |
| 37. | 31730 | 14.8% | 5.4%(+9.40)#37 | 4.9%(+9.90)#1,567 |
| 38. | 31532 | 14.8% | 5.4%(+9.40)#38 | 4.9%(+9.90)#1,580 |
| 39. | 31810 | 14.8% | 5.4%(+9.40)#39 | 4.9%(+9.90)#1,586 |
| 40. | 30901 | 14.7% | 5.4%(+9.30)#40 | 4.9%(+9.80)#1,592 |
| 41. | 31638 | 14.6% | 5.4%(+9.20)#41 | 4.9%(+9.70)#1,631 |
| 42. | 31063 | 14.5% | 5.4%(+9.10)#42 | 4.9%(+9.60)#1,648 |
| 43. | 31085 | 14.4% | 5.4%(+9.00)#43 | 4.9%(+9.50)#1,673 |
| 44. | 30821 | 14.4% | 5.4%(+9.00)#44 | 4.9%(+9.50)#1,675 |
| 45. | 30423 | 14.3% | 5.4%(+8.90)#45 | 4.9%(+9.40)#1,715 |
| 46. | 30660 | 14.2% | 5.4%(+8.80)#46 | 4.9%(+9.30)#1,727 |
| 47. | 31720 | 14.0% | 5.4%(+8.60)#47 | 4.9%(+9.10)#1,789 |
| 48. | 31705 | 13.9% | 5.4%(+8.50)#48 | 4.9%(+9.00)#1,794 |
| 49. | 31567 | 13.9% | 5.4%(+8.50)#49 | 4.9%(+9.00)#1,809 |
| 50. | 39819 | 13.7% | 5.4%(+8.30)#50 | 4.9%(+8.80)#1,851 |
| 51. | 30808 | 13.7% | 5.4%(+8.30)#51 | 4.9%(+8.80)#1,856 |
| 52. | 31078 | 13.5% | 5.4%(+8.10)#52 | 4.9%(+8.60)#1,925 |
| 53. | 31012 | 13.4% | 5.4%(+8.00)#53 | 4.9%(+8.50)#1,952 |
| 54. | 31204 | 13.3% | 5.4%(+7.90)#54 | 4.9%(+8.40)#1,975 |
| 55. | 39842 | 13.3% | 5.4%(+7.90)#55 | 4.9%(+8.40)#1,981 |
| 56. | 39854 | 13.3% | 5.4%(+7.90)#56 | 4.9%(+8.40)#1,987 |
| 57. | 31044 | 13.2% | 5.4%(+7.80)#57 | 4.9%(+8.30)#2,008 |
| 58. | 31401 | 13.1% | 5.4%(+7.70)#58 | 4.9%(+8.20)#2,027 |
| 59. | 31701 | 13.1% | 5.4%(+7.70)#59 | 4.9%(+8.20)#2,030 |
| 60. | 31635 | 13.1% | 5.4%(+7.70)#60 | 4.9%(+8.20)#2,035 |
| 61. | 31565 | 13.1% | 5.4%(+7.70)#61 | 4.9%(+8.20)#2,043 |
| 62. | 31750 | 13.0% | 5.4%(+7.60)#62 | 4.9%(+8.10)#2,071 |
| 63. | 31812 | 13.0% | 5.4%(+7.60)#63 | 4.9%(+8.10)#2,093 |
| 64. | 30445 | 12.9% | 5.4%(+7.50)#64 | 4.9%(+8.00)#2,127 |
| 65. | 30820 | 12.9% | 5.4%(+7.50)#65 | 4.9%(+8.00)#2,135 |
| 66. | 31630 | 12.9% | 5.4%(+7.50)#66 | 4.9%(+8.00)#2,142 |
| 67. | 31903 | 12.8% | 5.4%(+7.40)#67 | 4.9%(+7.90)#2,157 |
| 68. | 30303 | 12.8% | 5.4%(+7.40)#68 | 4.9%(+7.90)#2,165 |
| 69. | 31816 | 12.7% | 5.4%(+7.30)#69 | 4.9%(+7.80)#2,201 |
| 70. | 31764 | 12.7% | 5.4%(+7.30)#70 | 4.9%(+7.80)#2,207 |
| 71. | 31333 | 12.7% | 5.4%(+7.30)#71 | 4.9%(+7.80)#2,223 |
| 72. | 30746 | 12.6% | 5.4%(+7.20)#72 | 4.9%(+7.70)#2,239 |
| 73. | 31051 | 12.5% | 5.4%(+7.10)#73 | 4.9%(+7.60)#2,282 |
| 74. | 31535 | 12.4% | 5.4%(+7.00)#74 | 4.9%(+7.50)#2,299 |
| 75. | 31079 | 12.4% | 5.4%(+7.00)#75 | 4.9%(+7.50)#2,305 |
| 76. | 31049 | 12.1% | 5.4%(+6.70)#76 | 4.9%(+7.20)#2,432 |
| 77. | 31781 | 11.9% | 5.4%(+6.50)#77 | 4.9%(+7.00)#2,524 |
| 78. | 30311 | 11.8% | 5.4%(+6.40)#78 | 4.9%(+6.90)#2,541 |
| 79. | 39828 | 11.8% | 5.4%(+6.40)#79 | 4.9%(+6.90)#2,544 |
| 80. | 30218 | 11.8% | 5.4%(+6.40)#80 | 4.9%(+6.90)#2,558 |
| 81. | 39813 | 11.7% | 5.4%(+6.30)#81 | 4.9%(+6.80)#2,597 |
| 82. | 31805 | 11.7% | 5.4%(+6.30)#82 | 4.9%(+6.80)#2,598 |
| 83. | 31622 | 11.7% | 5.4%(+6.30)#83 | 4.9%(+6.80)#2,599 |
| 84. | 30336 | 11.7% | 5.4%(+6.30)#84 | 4.9%(+6.80)#2,615 |
| 85. | 31030 | 11.6% | 5.4%(+6.20)#85 | 4.9%(+6.70)#2,628 |
| 86. | 30363 | 11.6% | 5.4%(+6.20)#86 | 4.9%(+6.70)#2,643 |
| 87. | 31070 | 11.6% | 5.4%(+6.20)#87 | 4.9%(+6.70)#2,654 |
| 88. | 30312 | 11.5% | 5.4%(+6.10)#88 | 4.9%(+6.60)#2,675 |
| 89. | 30413 | 11.5% | 5.4%(+6.10)#89 | 4.9%(+6.60)#2,700 |
| 90. | 30605 | 11.4% | 5.4%(+6.00)#90 | 4.9%(+6.50)#2,722 |
| 91. | 31901 | 11.4% | 5.4%(+6.00)#91 | 4.9%(+6.50)#2,740 |
| 92. | 31563 | 11.4% | 5.4%(+6.00)#92 | 4.9%(+6.50)#2,763 |
| 93. | 31415 | 11.3% | 5.4%(+5.90)#93 | 4.9%(+6.40)#2,791 |
| 94. | 31087 | 11.2% | 5.4%(+5.80)#94 | 4.9%(+6.30)#2,848 |
| 95. | 30833 | 11.2% | 5.4%(+5.80)#95 | 4.9%(+6.30)#2,859 |
| 96. | 31061 | 11.1% | 5.4%(+5.70)#96 | 4.9%(+6.20)#2,881 |
| 97. | 31315 | 11.1% | 5.4%(+5.70)#97 | 4.9%(+6.20)#2,898 |
| 98. | 31539 | 11.0% | 5.4%(+5.60)#98 | 4.9%(+6.10)#2,960 |
| 99. | 31031 | 11.0% | 5.4%(+5.60)#99 | 4.9%(+6.10)#2,968 |
| 100. | 30137 | 11.0% | 5.4%(+5.60)#100 | 4.9%(+6.10)#2,975 |
Common Questions
What are the Top 10 Zip Codes with the Highest Percentage of Households with Income Below $10,000 in Georgia?
Top 10 Zip Codes with the Highest Percentage of Households with Income Below $10,000 in Georgia are:
What zip code has the Highest Percentage of Households with Income Below $10,000 in Georgia?
30751 has the Highest Percentage of Households with Income Below $10,000 in Georgia with 100.0%.
What is the Percentage of Households with Income Below $10,000 in the State of Georgia?
Percentage of Households with Income Below $10,000 in Georgia is 5.4%.
What is the Percentage of Households with Income Below $10,000 in the United States?
Percentage of Households with Income Below $10,000 in the United States is 4.9%.