Zip Codes with the Highest Percentage of Households with Income Below $10,000 in Pennsylvania
RELATED REPORTS & OPTIONS
Household Income | $0-10k
Pennsylvania
Compare Zip Codes
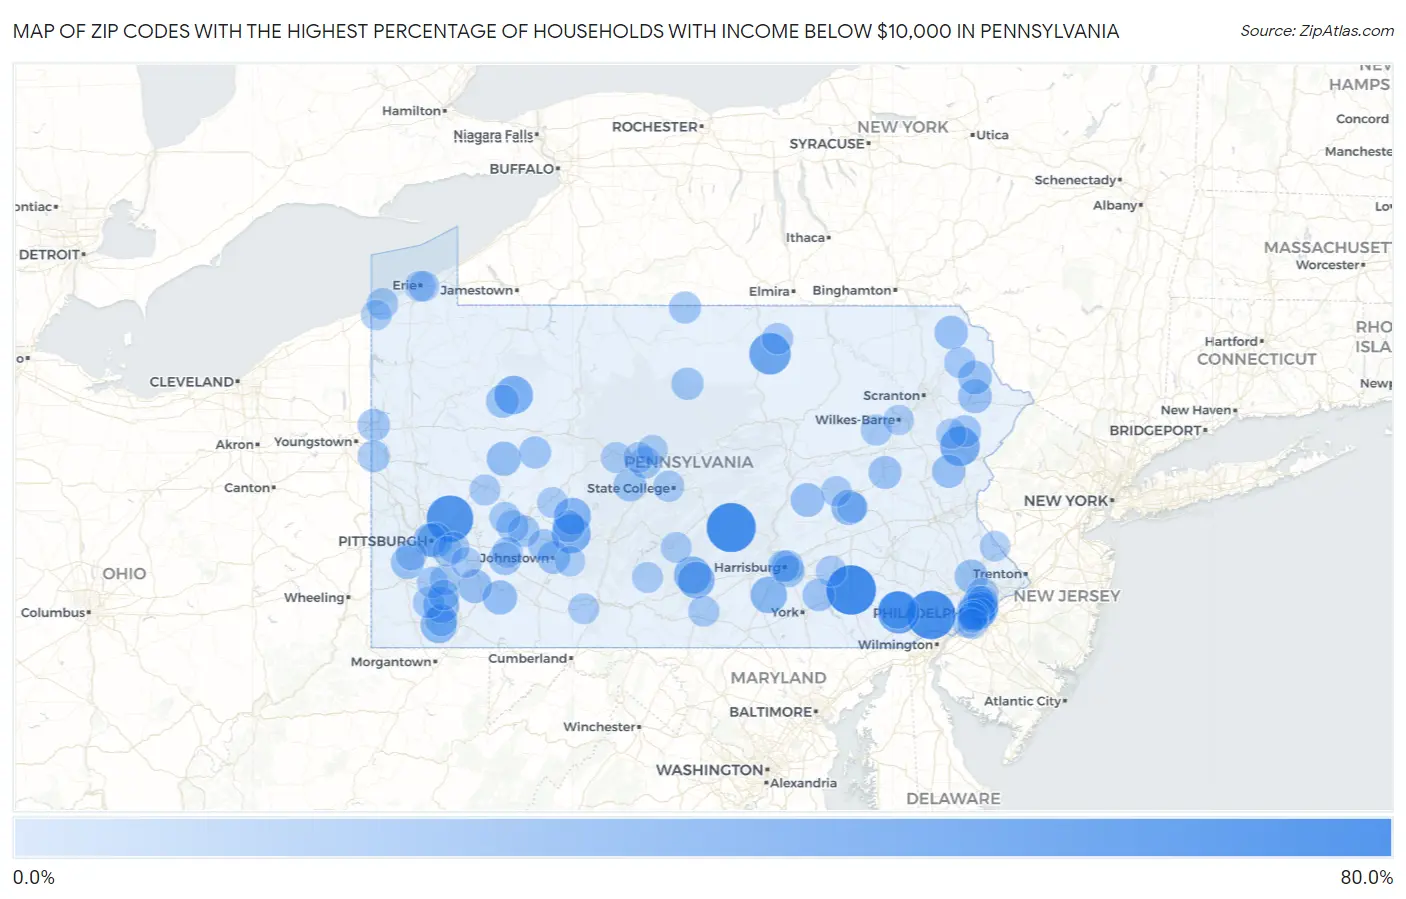
Map of Zip Codes with the Highest Percentage of Households with Income Below $10,000 in Pennsylvania
0.0%
80.0%
Zip Codes with the Highest Percentage of Households with Income Below $10,000 in Pennsylvania
| Zip Code | Households with Income < $10k | vs State | vs National | |
| 1. | 17606 | 62.8% | 4.8%(+58.0)#1 | 4.9%(+57.9)#68 |
| 2. | 17056 | 61.5% | 4.8%(+56.7)#2 | 4.9%(+56.6)#73 |
| 3. | 19383 | 59.5% | 4.8%(+54.7)#3 | 4.9%(+54.6)#79 |
| 4. | 15075 | 55.0% | 4.8%(+50.2)#4 | 4.9%(+50.1)#89 |
| 5. | 19367 | 42.4% | 4.8%(+37.6)#5 | 4.9%(+37.5)#156 |
| 6. | 16939 | 40.9% | 4.8%(+36.1)#6 | 4.9%(+36.0)#166 |
| 7. | 18355 | 35.9% | 4.8%(+31.1)#7 | 4.9%(+31.0)#207 |
| 8. | 15948 | 34.3% | 4.8%(+29.5)#8 | 4.9%(+29.4)#231 |
| 9. | 16220 | 32.6% | 4.8%(+27.8)#9 | 4.9%(+27.7)#279 |
| 10. | 19369 | 30.8% | 4.8%(+26.0)#10 | 4.9%(+25.9)#310 |
| 11. | 17219 | 29.3% | 4.8%(+24.5)#11 | 4.9%(+24.4)#342 |
| 12. | 17210 | 28.6% | 4.8%(+23.8)#12 | 4.9%(+23.7)#360 |
| 13. | 15737 | 28.6% | 4.8%(+23.8)#13 | 4.9%(+23.7)#361 |
| 14. | 17323 | 27.7% | 4.8%(+22.9)#14 | 4.9%(+22.8)#383 |
| 15. | 15351 | 27.1% | 4.8%(+22.3)#15 | 4.9%(+22.2)#398 |
| 16. | 15444 | 26.1% | 4.8%(+21.3)#16 | 4.9%(+21.2)#434 |
| 17. | 19104 | 24.4% | 4.8%(+19.6)#17 | 4.9%(+19.5)#511 |
| 18. | 15213 | 23.7% | 4.8%(+18.9)#18 | 4.9%(+18.8)#547 |
| 19. | 17923 | 23.7% | 4.8%(+18.9)#19 | 4.9%(+18.8)#550 |
| 20. | 16223 | 21.6% | 4.8%(+16.8)#20 | 4.9%(+16.7)#665 |
| 21. | 15462 | 21.5% | 4.8%(+16.7)#21 | 4.9%(+16.6)#677 |
| 22. | 15612 | 20.7% | 4.8%(+15.9)#22 | 4.9%(+15.8)#734 |
| 23. | 18451 | 20.3% | 4.8%(+15.5)#23 | 4.9%(+15.4)#776 |
| 24. | 17867 | 20.3% | 4.8%(+15.5)#24 | 4.9%(+15.4)#779 |
| 25. | 18473 | 20.1% | 4.8%(+15.3)#25 | 4.9%(+15.2)#790 |
| 26. | 15219 | 19.6% | 4.8%(+14.8)#26 | 4.9%(+14.7)#830 |
| 27. | 18454 | 19.6% | 4.8%(+14.8)#27 | 4.9%(+14.7)#840 |
| 28. | 19436 | 19.4% | 4.8%(+14.6)#28 | 4.9%(+14.5)#859 |
| 29. | 18331 | 19.2% | 4.8%(+14.4)#29 | 4.9%(+14.3)#886 |
| 30. | 15350 | 19.2% | 4.8%(+14.4)#30 | 4.9%(+14.3)#888 |
| 31. | 16332 | 18.5% | 4.8%(+13.7)#31 | 4.9%(+13.6)#956 |
| 32. | 18231 | 18.3% | 4.8%(+13.5)#32 | 4.9%(+13.4)#985 |
| 33. | 15901 | 18.2% | 4.8%(+13.4)#33 | 4.9%(+13.3)#995 |
| 34. | 16677 | 18.0% | 4.8%(+13.2)#34 | 4.9%(+13.1)#1,030 |
| 35. | 15620 | 17.8% | 4.8%(+13.0)#35 | 4.9%(+12.9)#1,050 |
| 36. | 17550 | 17.1% | 4.8%(+12.3)#36 | 4.9%(+12.2)#1,152 |
| 37. | 19121 | 17.0% | 4.8%(+12.2)#37 | 4.9%(+12.1)#1,157 |
| 38. | 15410 | 16.9% | 4.8%(+12.1)#38 | 4.9%(+12.0)#1,175 |
| 39. | 19139 | 16.7% | 4.8%(+11.9)#39 | 4.9%(+11.8)#1,200 |
| 40. | 17729 | 16.7% | 4.8%(+11.9)#40 | 4.9%(+11.8)#1,221 |
| 41. | 16121 | 16.6% | 4.8%(+11.8)#41 | 4.9%(+11.7)#1,234 |
| 42. | 15730 | 16.4% | 4.8%(+11.6)#42 | 4.9%(+11.5)#1,275 |
| 43. | 16849 | 16.4% | 4.8%(+11.6)#43 | 4.9%(+11.5)#1,276 |
| 44. | 15927 | 16.3% | 4.8%(+11.5)#44 | 4.9%(+11.4)#1,285 |
| 45. | 16941 | 16.0% | 4.8%(+11.2)#45 | 4.9%(+11.1)#1,353 |
| 46. | 17103 | 15.9% | 4.8%(+11.1)#46 | 4.9%(+11.0)#1,356 |
| 47. | 18342 | 15.8% | 4.8%(+11.0)#47 | 4.9%(+10.9)#1,385 |
| 48. | 16132 | 15.8% | 4.8%(+11.0)#48 | 4.9%(+10.9)#1,388 |
| 49. | 19095 | 15.5% | 4.8%(+10.7)#49 | 4.9%(+10.6)#1,424 |
| 50. | 15752 | 15.4% | 4.8%(+10.6)#50 | 4.9%(+10.5)#1,453 |
| 51. | 17104 | 15.2% | 4.8%(+10.4)#51 | 4.9%(+10.3)#1,477 |
| 52. | 15731 | 15.2% | 4.8%(+10.4)#52 | 4.9%(+10.3)#1,495 |
| 53. | 19140 | 15.1% | 4.8%(+10.3)#53 | 4.9%(+10.2)#1,497 |
| 54. | 15954 | 15.1% | 4.8%(+10.3)#54 | 4.9%(+10.2)#1,504 |
| 55. | 19132 | 15.0% | 4.8%(+10.2)#55 | 4.9%(+10.1)#1,514 |
| 56. | 17102 | 14.9% | 4.8%(+10.1)#56 | 4.9%(+10.00)#1,544 |
| 57. | 15333 | 14.9% | 4.8%(+10.1)#57 | 4.9%(+10.00)#1,550 |
| 58. | 15148 | 14.3% | 4.8%(+9.50)#58 | 4.9%(+9.40)#1,694 |
| 59. | 16430 | 14.3% | 4.8%(+9.50)#59 | 4.9%(+9.40)#1,707 |
| 60. | 18456 | 14.2% | 4.8%(+9.40)#60 | 4.9%(+9.30)#1,734 |
| 61. | 19122 | 14.1% | 4.8%(+9.30)#61 | 4.9%(+9.20)#1,739 |
| 62. | 16932 | 14.0% | 4.8%(+9.20)#62 | 4.9%(+9.10)#1,783 |
| 63. | 15366 | 13.7% | 4.8%(+8.90)#63 | 4.9%(+8.80)#1,866 |
| 64. | 15783 | 13.6% | 4.8%(+8.80)#64 | 4.9%(+8.70)#1,904 |
| 65. | 19133 | 13.5% | 4.8%(+8.70)#65 | 4.9%(+8.60)#1,908 |
| 66. | 16803 | 13.4% | 4.8%(+8.60)#66 | 4.9%(+8.50)#1,942 |
| 67. | 18617 | 13.4% | 4.8%(+8.60)#67 | 4.9%(+8.50)#1,954 |
| 68. | 19131 | 13.1% | 4.8%(+8.30)#68 | 4.9%(+8.20)#2,021 |
| 69. | 19144 | 13.0% | 4.8%(+8.20)#69 | 4.9%(+8.10)#2,060 |
| 70. | 15033 | 13.0% | 4.8%(+8.20)#70 | 4.9%(+8.10)#2,076 |
| 71. | 17254 | 13.0% | 4.8%(+8.20)#71 | 4.9%(+8.10)#2,094 |
| 72. | 15434 | 13.0% | 4.8%(+8.20)#72 | 4.9%(+8.10)#2,097 |
| 73. | 17064 | 12.9% | 4.8%(+8.10)#73 | 4.9%(+8.00)#2,134 |
| 74. | 15671 | 12.9% | 4.8%(+8.10)#74 | 4.9%(+8.00)#2,138 |
| 75. | 16674 | 12.9% | 4.8%(+8.10)#75 | 4.9%(+8.00)#2,141 |
| 76. | 15031 | 12.9% | 4.8%(+8.10)#76 | 4.9%(+8.00)#2,143 |
| 77. | 16236 | 12.9% | 4.8%(+8.10)#77 | 4.9%(+8.00)#2,147 |
| 78. | 19102 | 12.8% | 4.8%(+8.00)#78 | 4.9%(+7.90)#2,166 |
| 79. | 15550 | 12.8% | 4.8%(+8.00)#79 | 4.9%(+7.90)#2,173 |
| 80. | 16501 | 12.8% | 4.8%(+8.00)#80 | 4.9%(+7.90)#2,174 |
| 81. | 19141 | 12.7% | 4.8%(+7.90)#81 | 4.9%(+7.80)#2,191 |
| 82. | 15729 | 12.6% | 4.8%(+7.80)#82 | 4.9%(+7.70)#2,242 |
| 83. | 17075 | 12.5% | 4.8%(+7.70)#83 | 4.9%(+7.60)#2,279 |
| 84. | 16855 | 12.5% | 4.8%(+7.70)#84 | 4.9%(+7.60)#2,284 |
| 85. | 16503 | 12.3% | 4.8%(+7.50)#85 | 4.9%(+7.40)#2,331 |
| 86. | 19032 | 12.3% | 4.8%(+7.50)#86 | 4.9%(+7.40)#2,337 |
| 87. | 16847 | 12.3% | 4.8%(+7.50)#87 | 4.9%(+7.40)#2,356 |
| 88. | 17944 | 12.3% | 4.8%(+7.50)#88 | 4.9%(+7.40)#2,361 |
| 89. | 19143 | 12.2% | 4.8%(+7.40)#89 | 4.9%(+7.30)#2,364 |
| 90. | 19153 | 12.2% | 4.8%(+7.40)#90 | 4.9%(+7.30)#2,376 |
| 91. | 17840 | 12.1% | 4.8%(+7.30)#91 | 4.9%(+7.20)#2,446 |
| 92. | 15110 | 12.0% | 4.8%(+7.20)#92 | 4.9%(+7.10)#2,464 |
| 93. | 15691 | 12.0% | 4.8%(+7.20)#93 | 4.9%(+7.10)#2,487 |
| 94. | 18933 | 12.0% | 4.8%(+7.20)#94 | 4.9%(+7.10)#2,496 |
| 95. | 16443 | 11.9% | 4.8%(+7.10)#95 | 4.9%(+7.00)#2,531 |
| 96. | 15952 | 11.7% | 4.8%(+6.90)#96 | 4.9%(+6.80)#2,603 |
| 97. | 16859 | 11.6% | 4.8%(+6.80)#97 | 4.9%(+6.70)#2,662 |
| 98. | 18346 | 11.5% | 4.8%(+6.70)#98 | 4.9%(+6.60)#2,693 |
| 99. | 19142 | 11.4% | 4.8%(+6.60)#99 | 4.9%(+6.50)#2,723 |
| 100. | 18701 | 11.4% | 4.8%(+6.60)#100 | 4.9%(+6.50)#2,747 |
Common Questions
What are the Top 10 Zip Codes with the Highest Percentage of Households with Income Below $10,000 in Pennsylvania?
Top 10 Zip Codes with the Highest Percentage of Households with Income Below $10,000 in Pennsylvania are:
What zip code has the Highest Percentage of Households with Income Below $10,000 in Pennsylvania?
17606 has the Highest Percentage of Households with Income Below $10,000 in Pennsylvania with 62.8%.
What is the Percentage of Households with Income Below $10,000 in the State of Pennsylvania?
Percentage of Households with Income Below $10,000 in Pennsylvania is 4.8%.
What is the Percentage of Households with Income Below $10,000 in the United States?
Percentage of Households with Income Below $10,000 in the United States is 4.9%.