Zip Codes with the Highest Percentage of Households with Income Below $10,000 in Alaska
RELATED REPORTS & OPTIONS
Household Income | $0-10k
Alaska
Compare Zip Codes
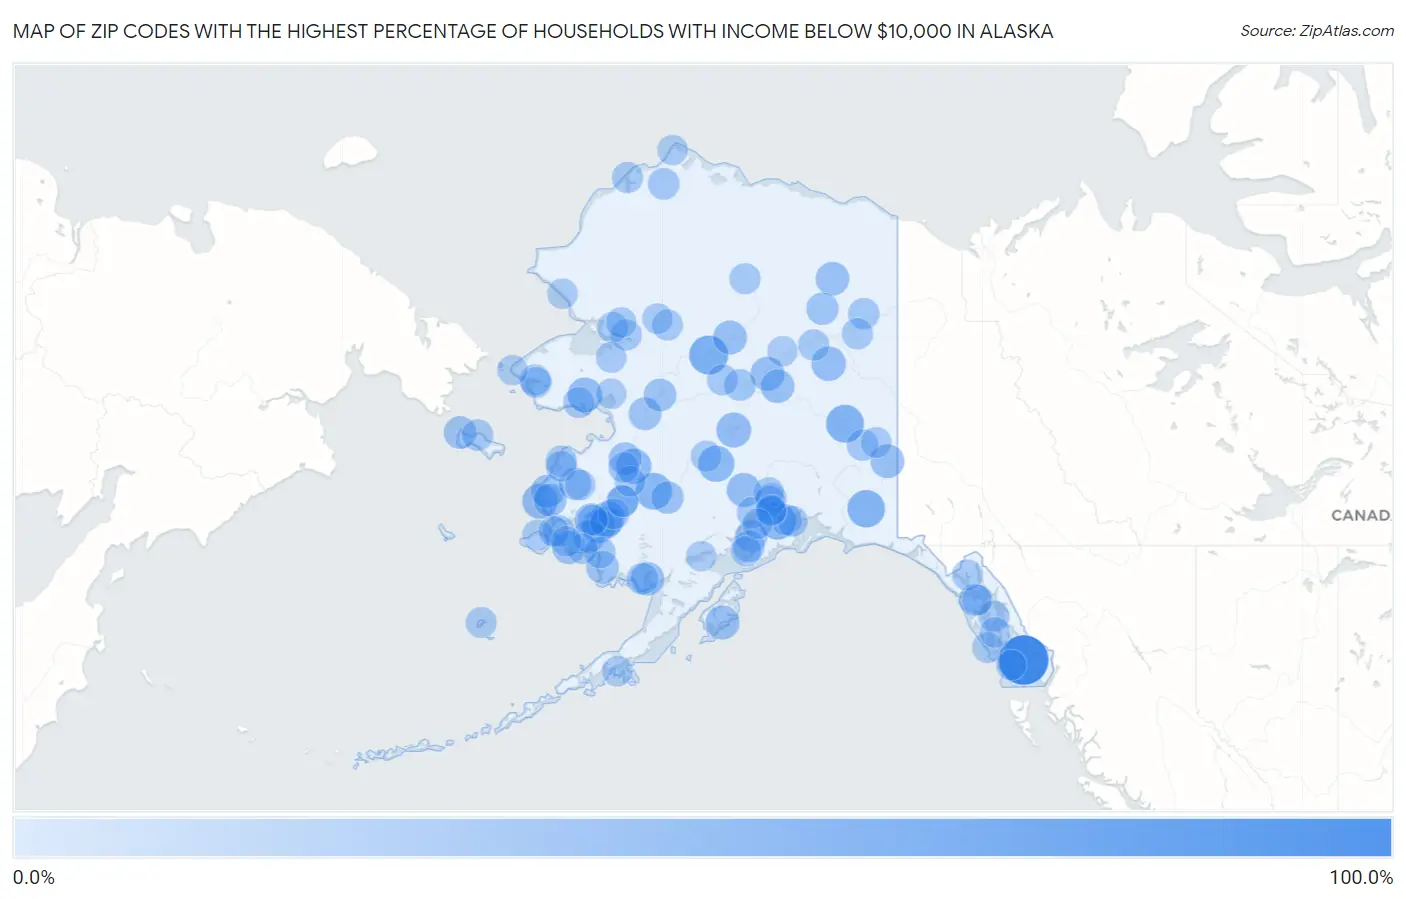
Map of Zip Codes with the Highest Percentage of Households with Income Below $10,000 in Alaska
0.0%
100.0%
Zip Codes with the Highest Percentage of Households with Income Below $10,000 in Alaska
| Zip Code | Households with Income < $10k | vs State | vs National | |
| 1. | 99903 | 100.0% | 3.9%(+96.1)#1 | 4.9%(+95.1)#37 |
| 2. | 99745 | 47.6% | 3.9%(+43.7)#2 | 4.9%(+42.7)#127 |
| 3. | 99706 | 41.7% | 3.9%(+37.8)#3 | 4.9%(+36.8)#161 |
| 4. | 99566 | 40.0% | 3.9%(+36.1)#4 | 4.9%(+35.1)#173 |
| 5. | 99605 | 36.5% | 3.9%(+32.6)#5 | 4.9%(+31.6)#204 |
| 6. | 99575 | 36.4% | 3.9%(+32.5)#6 | 4.9%(+31.5)#206 |
| 7. | 99691 | 33.3% | 3.9%(+29.4)#7 | 4.9%(+28.4)#250 |
| 8. | 99604 | 29.6% | 3.9%(+25.7)#8 | 4.9%(+24.7)#336 |
| 9. | 99665 | 29.4% | 3.9%(+25.5)#9 | 4.9%(+24.5)#339 |
| 10. | 99757 | 27.3% | 3.9%(+23.4)#10 | 4.9%(+22.4)#394 |
| 11. | 99739 | 26.5% | 3.9%(+22.6)#11 | 4.9%(+21.6)#422 |
| 12. | 99551 | 25.5% | 3.9%(+21.6)#12 | 4.9%(+20.6)#461 |
| 13. | 99730 | 25.4% | 3.9%(+21.5)#13 | 4.9%(+20.5)#472 |
| 14. | 99667 | 23.6% | 3.9%(+19.7)#14 | 4.9%(+18.7)#554 |
| 15. | 99767 | 23.5% | 3.9%(+19.6)#15 | 4.9%(+18.6)#565 |
| 16. | 99720 | 22.9% | 3.9%(+19.0)#16 | 4.9%(+18.0)#596 |
| 17. | 99643 | 22.7% | 3.9%(+18.8)#17 | 4.9%(+17.8)#601 |
| 18. | 99764 | 21.7% | 3.9%(+17.8)#18 | 4.9%(+16.8)#654 |
| 19. | 99722 | 21.5% | 3.9%(+17.6)#19 | 4.9%(+16.6)#678 |
| 20. | 99634 | 21.4% | 3.9%(+17.5)#20 | 4.9%(+16.5)#683 |
| 21. | 99758 | 21.3% | 3.9%(+17.4)#21 | 4.9%(+16.4)#691 |
| 22. | 99609 | 20.0% | 3.9%(+16.1)#22 | 4.9%(+15.1)#796 |
| 23. | 99569 | 20.0% | 3.9%(+16.1)#23 | 4.9%(+15.1)#804 |
| 24. | 99614 | 18.8% | 3.9%(+14.9)#24 | 4.9%(+13.9)#922 |
| 25. | 99662 | 18.3% | 3.9%(+14.4)#25 | 4.9%(+13.4)#984 |
| 26. | 99563 | 18.3% | 3.9%(+14.4)#26 | 4.9%(+13.4)#986 |
| 27. | 99748 | 17.4% | 3.9%(+13.5)#27 | 4.9%(+12.5)#1,111 |
| 28. | 99680 | 16.9% | 3.9%(+13.0)#28 | 4.9%(+12.0)#1,176 |
| 29. | 99590 | 16.7% | 3.9%(+12.8)#29 | 4.9%(+11.8)#1,219 |
| 30. | 99754 | 16.7% | 3.9%(+12.8)#30 | 4.9%(+11.8)#1,224 |
| 31. | 99589 | 16.2% | 3.9%(+12.3)#31 | 4.9%(+11.3)#1,314 |
| 32. | 99742 | 16.1% | 3.9%(+12.2)#32 | 4.9%(+11.2)#1,331 |
| 33. | 99668 | 16.0% | 3.9%(+12.1)#33 | 4.9%(+11.1)#1,352 |
| 34. | 99610 | 15.5% | 3.9%(+11.6)#34 | 4.9%(+10.6)#1,429 |
| 35. | 99781 | 15.4% | 3.9%(+11.5)#35 | 4.9%(+10.5)#1,452 |
| 36. | 99632 | 15.0% | 3.9%(+11.1)#36 | 4.9%(+10.1)#1,525 |
| 37. | 99841 | 14.3% | 3.9%(+10.4)#37 | 4.9%(+9.40)#1,711 |
| 38. | 99621 | 13.8% | 3.9%(+9.90)#38 | 4.9%(+8.90)#1,832 |
| 39. | 99690 | 12.5% | 3.9%(+8.60)#39 | 4.9%(+7.60)#2,286 |
| 40. | 99777 | 12.3% | 3.9%(+8.40)#40 | 4.9%(+7.40)#2,360 |
| 41. | 99639 | 12.2% | 3.9%(+8.30)#41 | 4.9%(+7.30)#2,388 |
| 42. | 99628 | 12.1% | 3.9%(+8.20)#42 | 4.9%(+7.20)#2,439 |
| 43. | 99791 | 12.1% | 3.9%(+8.20)#43 | 4.9%(+7.20)#2,449 |
| 44. | 99626 | 11.9% | 3.9%(+8.00)#44 | 4.9%(+7.00)#2,537 |
| 45. | 99769 | 10.9% | 3.9%(+7.00)#45 | 4.9%(+6.00)#3,035 |
| 46. | 99776 | 10.7% | 3.9%(+6.80)#46 | 4.9%(+5.80)#3,164 |
| 47. | 99655 | 10.5% | 3.9%(+6.60)#47 | 4.9%(+5.60)#3,266 |
| 48. | 99740 | 10.4% | 3.9%(+6.50)#48 | 4.9%(+5.50)#3,347 |
| 49. | 99682 | 10.1% | 3.9%(+6.20)#49 | 4.9%(+5.20)#3,560 |
| 50. | 99782 | 10.0% | 3.9%(+6.10)#50 | 4.9%(+5.10)#3,624 |
| 51. | 99581 | 9.9% | 3.9%(+6.00)#51 | 4.9%(+5.00)#3,687 |
| 52. | 99724 | 9.8% | 3.9%(+5.90)#52 | 4.9%(+4.90)#3,793 |
| 53. | 99607 | 9.7% | 3.9%(+5.80)#53 | 4.9%(+4.80)#3,858 |
| 54. | 99788 | 9.7% | 3.9%(+5.80)#54 | 4.9%(+4.80)#3,862 |
| 55. | 99785 | 9.3% | 3.9%(+5.40)#55 | 4.9%(+4.40)#4,178 |
| 56. | 99820 | 9.3% | 3.9%(+5.40)#56 | 4.9%(+4.40)#4,181 |
| 57. | 99587 | 9.2% | 3.9%(+5.30)#57 | 4.9%(+4.30)#4,256 |
| 58. | 99770 | 9.2% | 3.9%(+5.30)#58 | 4.9%(+4.30)#4,283 |
| 59. | 99660 | 9.0% | 3.9%(+5.10)#59 | 4.9%(+4.10)#4,485 |
| 60. | 99721 | 9.0% | 3.9%(+5.10)#60 | 4.9%(+4.10)#4,492 |
| 61. | 99773 | 8.7% | 3.9%(+4.80)#61 | 4.9%(+3.80)#4,807 |
| 62. | 99768 | 8.6% | 3.9%(+4.70)#62 | 4.9%(+3.70)#4,905 |
| 63. | 99784 | 8.6% | 3.9%(+4.70)#63 | 4.9%(+3.70)#4,906 |
| 64. | 99836 | 8.3% | 3.9%(+4.40)#64 | 4.9%(+3.40)#5,283 |
| 65. | 99627 | 8.2% | 3.9%(+4.30)#65 | 4.9%(+3.30)#5,398 |
| 66. | 99827 | 8.1% | 3.9%(+4.20)#66 | 4.9%(+3.20)#5,493 |
| 67. | 99694 | 8.1% | 3.9%(+4.20)#67 | 4.9%(+3.20)#5,506 |
| 68. | 99554 | 8.1% | 3.9%(+4.20)#68 | 4.9%(+3.20)#5,510 |
| 69. | 99630 | 8.1% | 3.9%(+4.20)#69 | 4.9%(+3.20)#5,530 |
| 70. | 99679 | 8.0% | 3.9%(+4.10)#70 | 4.9%(+3.10)#5,648 |
| 71. | 99778 | 7.9% | 3.9%(+4.00)#71 | 4.9%(+3.00)#5,783 |
| 72. | 99780 | 7.5% | 3.9%(+3.60)#72 | 4.9%(+2.60)#6,285 |
| 73. | 99763 | 7.5% | 3.9%(+3.60)#73 | 4.9%(+2.60)#6,305 |
| 74. | 99693 | 7.1% | 3.9%(+3.20)#74 | 4.9%(+2.20)#6,921 |
| 75. | 99556 | 7.0% | 3.9%(+3.10)#75 | 4.9%(+2.10)#7,037 |
| 76. | 99830 | 7.0% | 3.9%(+3.10)#76 | 4.9%(+2.10)#7,079 |
| 77. | 99786 | 7.0% | 3.9%(+3.10)#78 | 4.9%(+2.10)#7,087 |
| 78. | 99602 | 7.0% | 3.9%(+3.10)#79 | 4.9%(+2.10)#7,088 |
| 79. | 99658 | 6.9% | 3.9%(+3.00)#80 | 4.9%(+2.00)#7,246 |
| 80. | 99727 | 6.8% | 3.9%(+2.90)#81 | 4.9%(+1.90)#7,487 |
| 81. | 99652 | 6.7% | 3.9%(+2.80)#82 | 4.9%(+1.80)#7,608 |
| 82. | 99688 | 6.7% | 3.9%(+2.80)#83 | 4.9%(+1.80)#7,623 |
| 83. | 99558 | 6.7% | 3.9%(+2.80)#84 | 4.9%(+1.80)#7,688 |
| 84. | 99637 | 6.5% | 3.9%(+2.60)#85 | 4.9%(+1.60)#8,045 |
| 85. | 99641 | 6.5% | 3.9%(+2.60)#86 | 4.9%(+1.60)#8,047 |
| 86. | 99749 | 6.5% | 3.9%(+2.60)#87 | 4.9%(+1.60)#8,070 |
| 87. | 99508 | 6.3% | 3.9%(+2.40)#88 | 4.9%(+1.40)#8,311 |
| 88. | 99829 | 6.3% | 3.9%(+2.40)#89 | 4.9%(+1.40)#8,461 |
| 89. | 99622 | 6.3% | 3.9%(+2.40)#90 | 4.9%(+1.40)#8,477 |
| 90. | 99701 | 6.1% | 3.9%(+2.20)#91 | 4.9%(+1.20)#8,785 |
| 91. | 99723 | 6.1% | 3.9%(+2.20)#92 | 4.9%(+1.20)#8,841 |
| 92. | 99925 | 6.1% | 3.9%(+2.20)#93 | 4.9%(+1.20)#8,922 |
| 93. | 99753 | 6.1% | 3.9%(+2.20)#94 | 4.9%(+1.20)#8,943 |
| 94. | 99501 | 5.9% | 3.9%(+2.00)#95 | 4.9%(+1.00)#9,259 |
| 95. | 99661 | 5.9% | 3.9%(+2.00)#96 | 4.9%(+1.00)#9,381 |
| 96. | 99783 | 5.8% | 3.9%(+1.90)#97 | 4.9%(+0.900)#9,671 |
| 97. | 99606 | 5.8% | 3.9%(+1.90)#98 | 4.9%(+0.900)#9,675 |
| 98. | 99611 | 5.7% | 3.9%(+1.80)#99 | 4.9%(+0.800)#9,759 |
| 99. | 99750 | 5.6% | 3.9%(+1.70)#100 | 4.9%(+0.700)#10,139 |
| 100. | 99561 | 5.6% | 3.9%(+1.70)#101 | 4.9%(+0.700)#10,158 |
Common Questions
What are the Top 10 Zip Codes with the Highest Percentage of Households with Income Below $10,000 in Alaska?
Top 10 Zip Codes with the Highest Percentage of Households with Income Below $10,000 in Alaska are:
What zip code has the Highest Percentage of Households with Income Below $10,000 in Alaska?
99903 has the Highest Percentage of Households with Income Below $10,000 in Alaska with 100.0%.
What is the Percentage of Households with Income Below $10,000 in the State of Alaska?
Percentage of Households with Income Below $10,000 in Alaska is 3.9%.
What is the Percentage of Households with Income Below $10,000 in the United States?
Percentage of Households with Income Below $10,000 in the United States is 4.9%.