Zip Codes with the Highest Percentage of Households with Income Below $10,000 in New Jersey
RELATED REPORTS & OPTIONS
Household Income | $0-10k
New Jersey
Compare Zip Codes
Map of Zip Codes with the Highest Percentage of Households with Income Below $10,000 in New Jersey
0.0%
100.0%
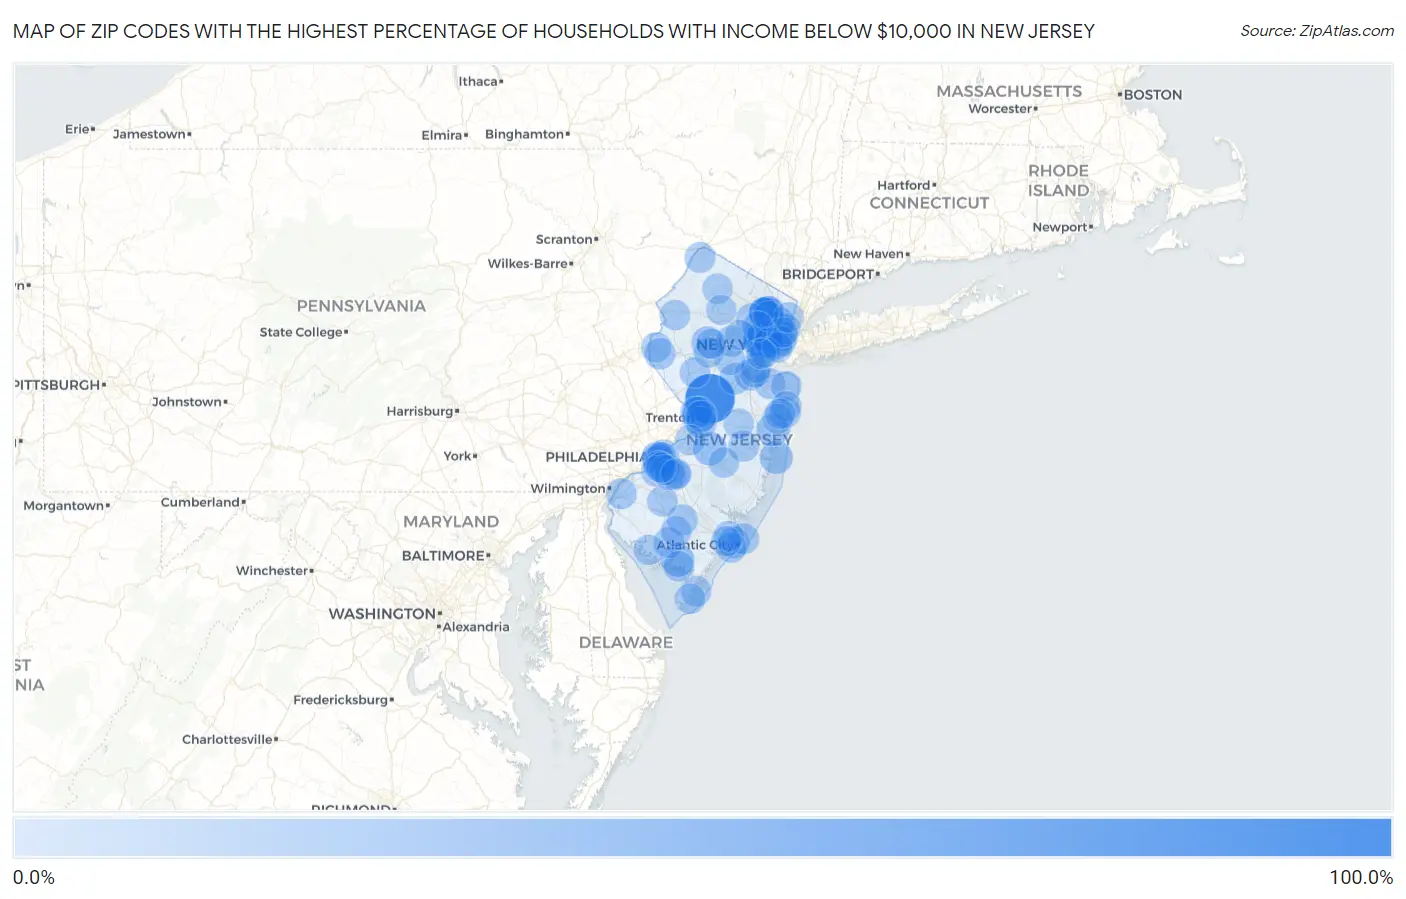
Zip Codes with the Highest Percentage of Households with Income Below $10,000 in New Jersey
| Zip Code | Households with Income < $10k | vs State | vs National | |
| 1. | 08544 | 100.0% | 4.1% (+95.9)#1 | 4.9% (+95.1)#3 |
| 2. | 08042 | 21.1% | 4.1% (+17.0)#2 | 4.9% (+16.2)#704 |
| 3. | 08327 | 20.7% | 4.1% (+16.6)#3 | 4.9% (+15.8)#731 |
| 4. | 08608 | 19.1% | 4.1% (+15.0)#4 | 4.9% (+14.2)#895 |
| 5. | 08751 | 18.2% | 4.1% (+14.1)#5 | 4.9% (+13.3)#996 |
| 6. | 07108 | 18.0% | 4.1% (+13.9)#6 | 4.9% (+13.1)#1,021 |
| 7. | 07505 | 17.8% | 4.1% (+13.7)#7 | 4.9% (+12.9)#1,047 |
| 8. | 08104 | 16.1% | 4.1% (+12.0)#8 | 4.9% (+11.2)#1,317 |
| 9. | 08720 | 15.9% | 4.1% (+11.8)#9 | 4.9% (+11.0)#1,366 |
| 10. | 07102 | 15.6% | 4.1% (+11.5)#10 | 4.9% (+10.7)#1,412 |
| 11. | 08103 | 14.9% | 4.1% (+10.8)#11 | 4.9% (+10.00)#1,541 |
| 12. | 07934 | 14.0% | 4.1% (+9.90)#12 | 4.9% (+9.10)#1,772 |
| 13. | 08638 | 13.6% | 4.1% (+9.50)#13 | 4.9% (+8.70)#1,876 |
| 14. | 07103 | 13.1% | 4.1% (+9.00)#14 | 4.9% (+8.20)#2,023 |
| 15. | 07501 | 12.2% | 4.1% (+8.10)#15 | 4.9% (+7.30)#2,366 |
| 16. | 07114 | 12.2% | 4.1% (+8.10)#16 | 4.9% (+7.30)#2,375 |
| 17. | 08102 | 12.1% | 4.1% (+8.00)#17 | 4.9% (+7.20)#2,414 |
| 18. | 07018 | 11.9% | 4.1% (+7.80)#18 | 4.9% (+7.00)#2,502 |
| 19. | 08611 | 11.7% | 4.1% (+7.60)#19 | 4.9% (+6.80)#2,583 |
| 20. | 08618 | 11.6% | 4.1% (+7.50)#20 | 4.9% (+6.70)#2,620 |
| 21. | 08401 | 11.6% | 4.1% (+7.50)#21 | 4.9% (+6.70)#2,621 |
| 22. | 08901 | 11.5% | 4.1% (+7.40)#22 | 4.9% (+6.60)#2,669 |
| 23. | 07723 | 11.1% | 4.1% (+7.00)#23 | 4.9% (+6.20)#2,922 |
| 24. | 07608 | 11.1% | 4.1% (+7.00)#24 | 4.9% (+6.20)#2,938 |
| 25. | 07050 | 10.8% | 4.1% (+6.70)#25 | 4.9% (+5.90)#3,057 |
| 26. | 08832 | 10.8% | 4.1% (+6.70)#26 | 4.9% (+5.90)#3,084 |
| 27. | 07112 | 10.6% | 4.1% (+6.50)#27 | 4.9% (+5.70)#3,175 |
| 28. | 07106 | 10.5% | 4.1% (+6.40)#28 | 4.9% (+5.60)#3,227 |
| 29. | 07107 | 10.0% | 4.1% (+5.90)#29 | 4.9% (+5.10)#3,564 |
| 30. | 08609 | 9.9% | 4.1% (+5.80)#30 | 4.9% (+5.00)#3,657 |
| 31. | 07504 | 9.8% | 4.1% (+5.70)#31 | 4.9% (+4.90)#3,725 |
| 32. | 07522 | 9.5% | 4.1% (+5.40)#32 | 4.9% (+4.60)#3,959 |
| 33. | 07104 | 9.3% | 4.1% (+5.20)#33 | 4.9% (+4.40)#4,091 |
| 34. | 08804 | 9.3% | 4.1% (+5.20)#34 | 4.9% (+4.40)#4,135 |
| 35. | 07111 | 9.0% | 4.1% (+4.90)#35 | 4.9% (+4.10)#4,394 |
| 36. | 07976 | 8.9% | 4.1% (+4.80)#36 | 4.9% (+4.00)#4,590 |
| 37. | 08110 | 8.7% | 4.1% (+4.60)#37 | 4.9% (+3.80)#4,733 |
| 38. | 07304 | 8.6% | 4.1% (+4.50)#38 | 4.9% (+3.70)#4,814 |
| 39. | 08105 | 8.4% | 4.1% (+4.30)#39 | 4.9% (+3.50)#5,031 |
| 40. | 08069 | 8.3% | 4.1% (+4.20)#40 | 4.9% (+3.40)#5,186 |
| 41. | 08203 | 8.3% | 4.1% (+4.20)#41 | 4.9% (+3.40)#5,200 |
| 42. | 08733 | 8.3% | 4.1% (+4.20)#42 | 4.9% (+3.40)#5,217 |
| 43. | 08310 | 8.3% | 4.1% (+4.20)#43 | 4.9% (+3.40)#5,251 |
| 44. | 07827 | 8.2% | 4.1% (+4.10)#44 | 4.9% (+3.30)#5,335 |
| 45. | 07524 | 8.1% | 4.1% (+4.00)#45 | 4.9% (+3.20)#5,428 |
| 46. | 07306 | 7.9% | 4.1% (+3.80)#46 | 4.9% (+3.00)#5,666 |
| 47. | 08332 | 7.8% | 4.1% (+3.70)#47 | 4.9% (+2.90)#5,800 |
| 48. | 07072 | 7.2% | 4.1% (+3.10)#48 | 4.9% (+2.30)#6,690 |
| 49. | 08361 | 7.1% | 4.1% (+3.00)#49 | 4.9% (+2.20)#6,801 |
| 50. | 07734 | 7.1% | 4.1% (+3.00)#50 | 4.9% (+2.20)#6,813 |
| 51. | 07004 | 7.1% | 4.1% (+3.00)#51 | 4.9% (+2.20)#6,831 |
| 52. | 07077 | 7.0% | 4.1% (+2.90)#52 | 4.9% (+2.10)#7,038 |
| 53. | 08314 | 6.9% | 4.1% (+2.80)#53 | 4.9% (+2.00)#7,265 |
| 54. | 07017 | 6.8% | 4.1% (+2.70)#54 | 4.9% (+1.90)#7,306 |
| 55. | 08406 | 6.8% | 4.1% (+2.70)#55 | 4.9% (+1.90)#7,382 |
| 56. | 08312 | 6.7% | 4.1% (+2.60)#56 | 4.9% (+1.80)#7,585 |
| 57. | 08093 | 6.6% | 4.1% (+2.50)#57 | 4.9% (+1.70)#7,763 |
| 58. | 07732 | 6.6% | 4.1% (+2.50)#58 | 4.9% (+1.70)#7,791 |
| 59. | 08045 | 6.6% | 4.1% (+2.50)#59 | 4.9% (+1.70)#7,811 |
| 60. | 08030 | 6.5% | 4.1% (+2.40)#60 | 4.9% (+1.60)#7,943 |
| 61. | 08887 | 6.5% | 4.1% (+2.40)#61 | 4.9% (+1.60)#8,034 |
| 62. | 07844 | 6.5% | 4.1% (+2.40)#62 | 4.9% (+1.60)#8,081 |
| 63. | 08084 | 6.4% | 4.1% (+2.30)#63 | 4.9% (+1.50)#8,188 |
| 64. | 08026 | 6.4% | 4.1% (+2.30)#64 | 4.9% (+1.50)#8,227 |
| 65. | 07087 | 6.3% | 4.1% (+2.20)#65 | 4.9% (+1.40)#8,289 |
| 66. | 08016 | 6.3% | 4.1% (+2.20)#66 | 4.9% (+1.40)#8,320 |
| 67. | 07740 | 6.3% | 4.1% (+2.20)#67 | 4.9% (+1.40)#8,325 |
| 68. | 07029 | 6.3% | 4.1% (+2.20)#68 | 4.9% (+1.40)#8,345 |
| 69. | 07514 | 6.3% | 4.1% (+2.20)#69 | 4.9% (+1.40)#8,355 |
| 70. | 08201 | 6.3% | 4.1% (+2.20)#70 | 4.9% (+1.40)#8,380 |
| 71. | 08510 | 6.3% | 4.1% (+2.20)#71 | 4.9% (+1.40)#8,401 |
| 72. | 08861 | 6.2% | 4.1% (+2.10)#72 | 4.9% (+1.30)#8,511 |
| 73. | 08812 | 6.2% | 4.1% (+2.10)#73 | 4.9% (+1.30)#8,576 |
| 74. | 08007 | 6.2% | 4.1% (+2.10)#74 | 4.9% (+1.30)#8,610 |
| 75. | 08247 | 6.2% | 4.1% (+2.10)#75 | 4.9% (+1.30)#8,681 |
| 76. | 07022 | 6.1% | 4.1% (+2.00)#76 | 4.9% (+1.20)#8,800 |
| 77. | 07310 | 6.1% | 4.1% (+2.00)#77 | 4.9% (+1.20)#8,802 |
| 78. | 07105 | 6.0% | 4.1% (+1.90)#78 | 4.9% (+1.10)#8,959 |
| 79. | 07206 | 6.0% | 4.1% (+1.90)#79 | 4.9% (+1.10)#8,990 |
| 80. | 08015 | 6.0% | 4.1% (+1.90)#80 | 4.9% (+1.10)#9,022 |
| 81. | 07921 | 6.0% | 4.1% (+1.90)#81 | 4.9% (+1.10)#9,055 |
| 82. | 07439 | 6.0% | 4.1% (+1.90)#82 | 4.9% (+1.10)#9,109 |
| 83. | 07305 | 5.9% | 4.1% (+1.80)#83 | 4.9% (+1.00)#9,184 |
| 84. | 08865 | 5.9% | 4.1% (+1.80)#84 | 4.9% (+1.00)#9,224 |
| 85. | 07503 | 5.9% | 4.1% (+1.80)#85 | 4.9% (+1.00)#9,247 |
| 86. | 07931 | 5.9% | 4.1% (+1.80)#86 | 4.9% (+1.00)#9,324 |
| 87. | 08043 | 5.8% | 4.1% (+1.70)#87 | 4.9% (+0.900)#9,471 |
| 88. | 08260 | 5.8% | 4.1% (+1.70)#88 | 4.9% (+0.900)#9,528 |
| 89. | 08059 | 5.8% | 4.1% (+1.70)#89 | 4.9% (+0.900)#9,565 |
| 90. | 07047 | 5.6% | 4.1% (+1.50)#90 | 4.9% (+0.700)#9,948 |
| 91. | 07631 | 5.6% | 4.1% (+1.50)#91 | 4.9% (+0.700)#9,978 |
| 92. | 08232 | 5.6% | 4.1% (+1.50)#92 | 4.9% (+0.700)#10,003 |
| 93. | 07502 | 5.6% | 4.1% (+1.50)#93 | 4.9% (+0.700)#10,011 |
| 94. | 07044 | 5.6% | 4.1% (+1.50)#94 | 4.9% (+0.700)#10,017 |
| 95. | 07885 | 5.6% | 4.1% (+1.50)#95 | 4.9% (+0.700)#10,024 |
| 96. | 07932 | 5.6% | 4.1% (+1.50)#96 | 4.9% (+0.700)#10,029 |
| 97. | 07202 | 5.5% | 4.1% (+1.40)#97 | 4.9% (+0.600)#10,198 |
| 98. | 07753 | 5.5% | 4.1% (+1.40)#98 | 4.9% (+0.600)#10,211 |
| 99. | 08311 | 5.5% | 4.1% (+1.40)#99 | 4.9% (+0.600)#10,367 |
| 100. | 07712 | 5.4% | 4.1% (+1.30)#100 | 4.9% (+0.500)#10,446 |
Common Questions
What are the Top 10 Zip Codes with the Highest Percentage of Households with Income Below $10,000 in New Jersey?
Top 10 Zip Codes with the Highest Percentage of Households with Income Below $10,000 in New Jersey are:
What zip code has the Highest Percentage of Households with Income Below $10,000 in New Jersey?
08544 has the Highest Percentage of Households with Income Below $10,000 in New Jersey with 100.0%.
What is the Percentage of Households with Income Below $10,000 in the State of New Jersey?
Percentage of Households with Income Below $10,000 in New Jersey is 4.1%.
What is the Percentage of Households with Income Below $10,000 in the United States?
Percentage of Households with Income Below $10,000 in the United States is 4.9%.