Zip Codes with the Highest Percentage of Households with Income Below $10,000 in Vermont
RELATED REPORTS & OPTIONS
Household Income | $0-10k
Vermont
Compare Zip Codes
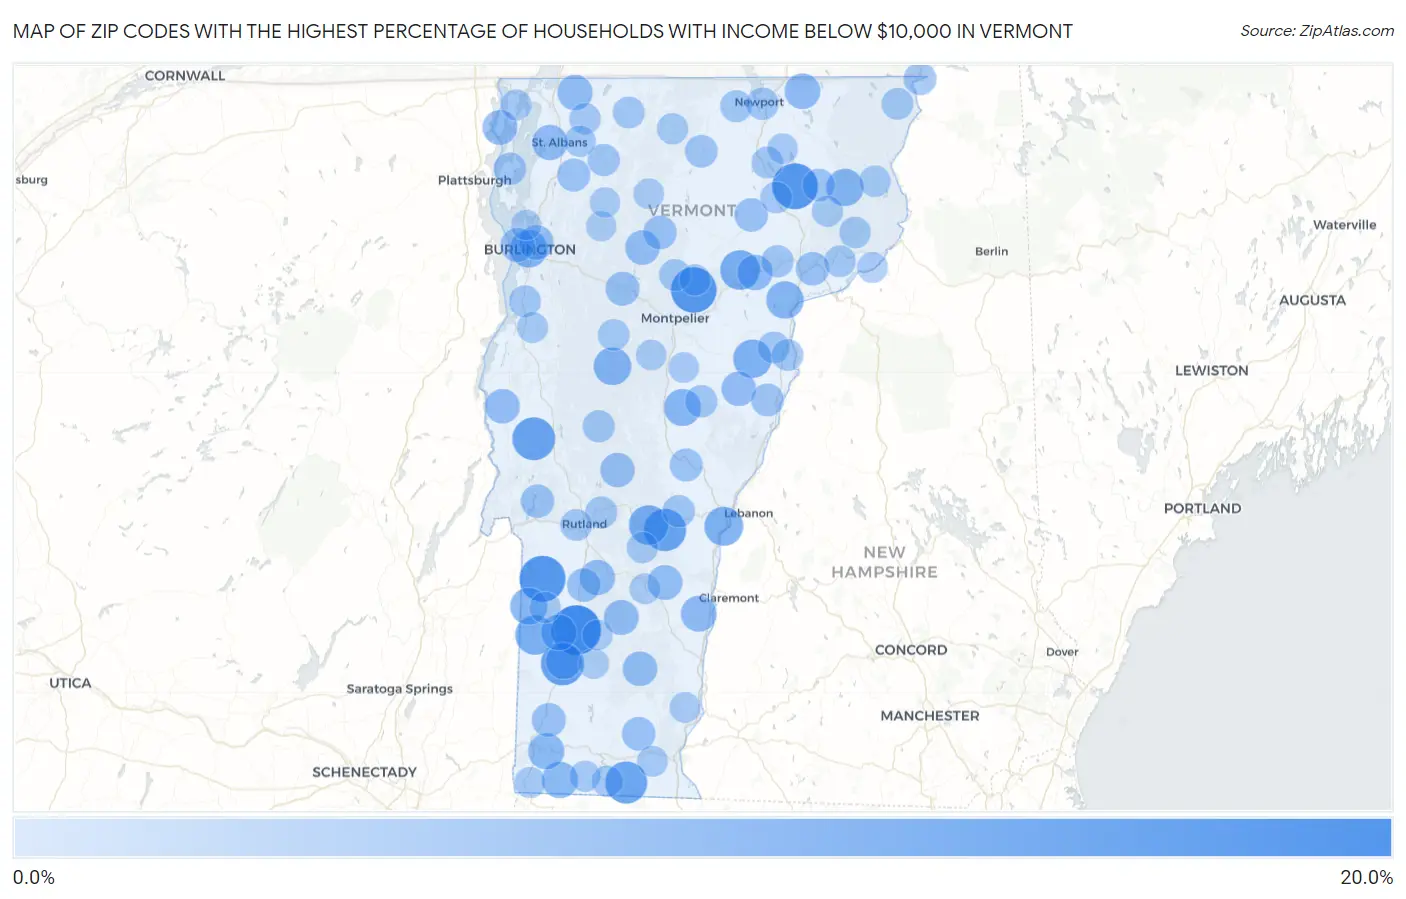
Map of Zip Codes with the Highest Percentage of Households with Income Below $10,000 in Vermont
0.0%
20.0%
Zip Codes with the Highest Percentage of Households with Income Below $10,000 in Vermont
| Zip Code | Households with Income < $10k | vs State | vs National | |
| 1. | 05253 | 16.1% | 3.9%(+12.2)#1 | 4.9%(+11.2)#1,326 |
| 2. | 05774 | 13.7% | 3.9%(+9.80)#2 | 4.9%(+8.80)#1,862 |
| 3. | 05867 | 13.6% | 3.9%(+9.70)#3 | 4.9%(+8.70)#1,897 |
| 4. | 05640 | 13.5% | 3.9%(+9.60)#4 | 4.9%(+8.60)#1,938 |
| 5. | 05254 | 11.8% | 3.9%(+7.90)#5 | 4.9%(+6.90)#2,574 |
| 6. | 05778 | 11.6% | 3.9%(+7.70)#6 | 4.9%(+6.70)#2,651 |
| 7. | 05034 | 11.3% | 3.9%(+7.40)#7 | 4.9%(+6.40)#2,831 |
| 8. | 05342 | 11.1% | 3.9%(+7.20)#8 | 4.9%(+6.20)#2,923 |
| 9. | 05647 | 9.5% | 3.9%(+5.60)#9 | 4.9%(+4.60)#3,996 |
| 10. | 05035 | 9.5% | 3.9%(+5.60)#10 | 4.9%(+4.60)#4,008 |
| 11. | 05776 | 9.4% | 3.9%(+5.50)#11 | 4.9%(+4.50)#4,080 |
| 12. | 05052 | 9.0% | 3.9%(+5.10)#12 | 4.9%(+4.10)#4,483 |
| 13. | 05076 | 8.7% | 3.9%(+4.80)#13 | 4.9%(+3.80)#4,801 |
| 14. | 05401 | 8.2% | 3.9%(+4.30)#14 | 4.9%(+3.30)#5,294 |
| 15. | 05674 | 8.2% | 3.9%(+4.30)#15 | 4.9%(+3.30)#5,355 |
| 16. | 05821 | 8.1% | 3.9%(+4.20)#16 | 4.9%(+3.20)#5,512 |
| 17. | 05837 | 8.0% | 3.9%(+4.10)#17 | 4.9%(+3.10)#5,652 |
| 18. | 05775 | 7.8% | 3.9%(+3.90)#18 | 4.9%(+2.90)#5,913 |
| 19. | 05041 | 7.8% | 3.9%(+3.90)#19 | 4.9%(+2.90)#5,926 |
| 20. | 05352 | 7.4% | 3.9%(+3.50)#20 | 4.9%(+2.50)#6,447 |
| 21. | 05201 | 7.2% | 3.9%(+3.30)#21 | 4.9%(+2.30)#6,658 |
| 22. | 05255 | 7.1% | 3.9%(+3.20)#22 | 4.9%(+2.20)#6,846 |
| 23. | 05156 | 7.0% | 3.9%(+3.10)#23 | 4.9%(+2.10)#7,006 |
| 24. | 05251 | 7.0% | 3.9%(+3.10)#24 | 4.9%(+2.10)#7,058 |
| 25. | 05830 | 6.9% | 3.9%(+3.00)#25 | 4.9%(+2.00)#7,243 |
| 26. | 05873 | 6.8% | 3.9%(+2.90)#26 | 4.9%(+1.90)#7,485 |
| 27. | 05478 | 6.7% | 3.9%(+2.80)#27 | 4.9%(+1.80)#7,557 |
| 28. | 05459 | 6.6% | 3.9%(+2.70)#28 | 4.9%(+1.70)#7,833 |
| 29. | 05742 | 6.6% | 3.9%(+2.70)#29 | 4.9%(+1.70)#7,865 |
| 30. | 05153 | 6.4% | 3.9%(+2.50)#30 | 4.9%(+1.50)#8,261 |
| 31. | 05161 | 6.4% | 3.9%(+2.50)#31 | 4.9%(+1.50)#8,262 |
| 32. | 05404 | 6.3% | 3.9%(+2.40)#32 | 4.9%(+1.40)#8,387 |
| 33. | 05463 | 6.3% | 3.9%(+2.40)#33 | 4.9%(+1.40)#8,480 |
| 34. | 05672 | 6.2% | 3.9%(+2.30)#34 | 4.9%(+1.30)#8,617 |
| 35. | 05734 | 6.2% | 3.9%(+2.30)#35 | 4.9%(+1.30)#8,670 |
| 36. | 05039 | 6.2% | 3.9%(+2.30)#36 | 4.9%(+1.30)#8,678 |
| 37. | 05359 | 6.2% | 3.9%(+2.30)#37 | 4.9%(+1.30)#8,694 |
| 38. | 05762 | 6.1% | 3.9%(+2.20)#38 | 4.9%(+1.20)#8,934 |
| 39. | 05408 | 5.9% | 3.9%(+2.00)#39 | 4.9%(+1.00)#9,282 |
| 40. | 05676 | 5.8% | 3.9%(+1.90)#40 | 4.9%(+0.900)#9,577 |
| 41. | 05262 | 5.8% | 3.9%(+1.90)#41 | 4.9%(+0.900)#9,612 |
| 42. | 05661 | 5.6% | 3.9%(+1.70)#42 | 4.9%(+0.700)#10,049 |
| 43. | 05351 | 5.6% | 3.9%(+1.70)#43 | 4.9%(+0.700)#10,177 |
| 44. | 05819 | 5.5% | 3.9%(+1.60)#44 | 4.9%(+0.600)#10,282 |
| 45. | 05773 | 5.5% | 3.9%(+1.60)#45 | 4.9%(+0.600)#10,343 |
| 46. | 05732 | 5.5% | 3.9%(+1.60)#46 | 4.9%(+0.600)#10,382 |
| 47. | 05842 | 5.5% | 3.9%(+1.60)#47 | 4.9%(+0.600)#10,415 |
| 48. | 05454 | 5.2% | 3.9%(+1.30)#48 | 4.9%(+0.300)#11,177 |
| 49. | 05068 | 5.2% | 3.9%(+1.30)#49 | 4.9%(+0.300)#11,203 |
| 50. | 05033 | 5.1% | 3.9%(+1.20)#50 | 4.9%(+0.200)#11,523 |
| 51. | 05847 | 5.0% | 3.9%(+1.10)#51 | 4.9%(+0.100)#11,904 |
| 52. | 05902 | 5.0% | 3.9%(+1.10)#52 | 4.9%(+0.100)#11,954 |
| 53. | 05871 | 4.9% | 3.9%(+1.00)#53 | 4.9%(=0.000)#12,215 |
| 54. | 05855 | 4.8% | 3.9%(+0.900)#54 | 4.9%(-0.100)#12,415 |
| 55. | 05091 | 4.8% | 3.9%(+0.900)#55 | 4.9%(-0.100)#12,454 |
| 56. | 05458 | 4.8% | 3.9%(+0.900)#56 | 4.9%(-0.100)#12,487 |
| 57. | 05038 | 4.8% | 3.9%(+0.900)#57 | 4.9%(-0.100)#12,517 |
| 58. | 05828 | 4.7% | 3.9%(+0.800)#58 | 4.9%(-0.200)#12,836 |
| 59. | 05448 | 4.7% | 3.9%(+0.800)#59 | 4.9%(-0.200)#12,896 |
| 60. | 05748 | 4.7% | 3.9%(+0.800)#60 | 4.9%(-0.200)#12,919 |
| 61. | 05701 | 4.6% | 3.9%(+0.700)#61 | 4.9%(-0.300)#13,057 |
| 62. | 05857 | 4.6% | 3.9%(+0.700)#62 | 4.9%(-0.300)#13,238 |
| 63. | 05822 | 4.5% | 3.9%(+0.600)#63 | 4.9%(-0.400)#13,548 |
| 64. | 05450 | 4.4% | 3.9%(+0.500)#64 | 4.9%(-0.500)#13,838 |
| 65. | 05445 | 4.4% | 3.9%(+0.500)#65 | 4.9%(-0.500)#13,866 |
| 66. | 05682 | 4.4% | 3.9%(+0.500)#66 | 4.9%(-0.500)#13,943 |
| 67. | 05824 | 4.4% | 3.9%(+0.500)#67 | 4.9%(-0.500)#13,948 |
| 68. | 05069 | 4.4% | 3.9%(+0.500)#68 | 4.9%(-0.500)#13,982 |
| 69. | 05903 | 4.4% | 3.9%(+0.500)#69 | 4.9%(-0.500)#13,983 |
| 70. | 05081 | 4.4% | 3.9%(+0.500)#70 | 4.9%(-0.500)#13,986 |
| 71. | 05736 | 4.4% | 3.9%(+0.500)#71 | 4.9%(-0.500)#13,988 |
| 72. | 05673 | 4.3% | 3.9%(+0.400)#72 | 4.9%(-0.600)#14,290 |
| 73. | 05866 | 4.3% | 3.9%(+0.400)#73 | 4.9%(-0.600)#14,372 |
| 74. | 05483 | 4.2% | 3.9%(+0.300)#74 | 4.9%(-0.700)#14,702 |
| 75. | 05455 | 4.2% | 3.9%(+0.300)#75 | 4.9%(-0.700)#14,716 |
| 76. | 05905 | 4.2% | 3.9%(+0.300)#76 | 4.9%(-0.700)#14,740 |
| 77. | 05858 | 4.2% | 3.9%(+0.300)#77 | 4.9%(-0.700)#14,777 |
| 78. | 05761 | 4.1% | 3.9%(+0.200)#78 | 4.9%(-0.800)#15,124 |
| 79. | 05361 | 4.1% | 3.9%(+0.200)#79 | 4.9%(-0.800)#15,129 |
| 80. | 05471 | 4.1% | 3.9%(+0.200)#80 | 4.9%(-0.800)#15,143 |
| 81. | 05648 | 4.1% | 3.9%(+0.200)#81 | 4.9%(-0.800)#15,148 |
| 82. | 05056 | 4.1% | 3.9%(+0.200)#82 | 4.9%(-0.800)#15,157 |
| 83. | 05832 | 4.0% | 3.9%(+0.100)#83 | 4.9%(-0.900)#15,500 |
| 84. | 05350 | 4.0% | 3.9%(+0.100)#84 | 4.9%(-0.900)#15,522 |
| 85. | 05301 | 3.9% | 3.9%(=0.000)#85 | 4.9%(-1.00)#15,700 |
| 86. | 05261 | 3.9% | 3.9%(=0.000)#86 | 4.9%(-1.00)#15,840 |
| 87. | 05440 | 3.9% | 3.9%(=0.000)#87 | 4.9%(-1.00)#15,855 |
| 88. | 05473 | 3.9% | 3.9%(=0.000)#88 | 4.9%(-1.00)#15,864 |
| 89. | 05346 | 3.8% | 3.9%(-0.100)#89 | 4.9%(-1.10)#16,175 |
| 90. | 05149 | 3.8% | 3.9%(-0.100)#90 | 4.9%(-1.10)#16,235 |
| 91. | 05904 | 3.8% | 3.9%(-0.100)#91 | 4.9%(-1.10)#16,352 |
| 92. | 05663 | 3.7% | 3.9%(-0.200)#92 | 4.9%(-1.20)#16,548 |
| 93. | 05656 | 3.7% | 3.9%(-0.200)#93 | 4.9%(-1.20)#16,606 |
| 94. | 05679 | 3.7% | 3.9%(-0.200)#94 | 4.9%(-1.20)#16,618 |
| 95. | 05860 | 3.7% | 3.9%(-0.200)#95 | 4.9%(-1.20)#16,624 |
| 96. | 05446 | 3.6% | 3.9%(-0.300)#96 | 4.9%(-1.30)#16,903 |
| 97. | 05340 | 3.6% | 3.9%(-0.300)#97 | 4.9%(-1.30)#17,121 |
| 98. | 05152 | 3.6% | 3.9%(-0.300)#98 | 4.9%(-1.30)#17,148 |
| 99. | 05489 | 3.5% | 3.9%(-0.400)#99 | 4.9%(-1.40)#17,436 |
| 100. | 05444 | 3.5% | 3.9%(-0.400)#100 | 4.9%(-1.40)#17,504 |
Common Questions
What are the Top 10 Zip Codes with the Highest Percentage of Households with Income Below $10,000 in Vermont?
Top 10 Zip Codes with the Highest Percentage of Households with Income Below $10,000 in Vermont are:
What zip code has the Highest Percentage of Households with Income Below $10,000 in Vermont?
05253 has the Highest Percentage of Households with Income Below $10,000 in Vermont with 16.1%.
What is the Percentage of Households with Income Below $10,000 in the State of Vermont?
Percentage of Households with Income Below $10,000 in Vermont is 3.9%.
What is the Percentage of Households with Income Below $10,000 in the United States?
Percentage of Households with Income Below $10,000 in the United States is 4.9%.