Zip Codes with the Highest Percentage of Households with Income Below $10,000 in Rhode Island

RELATED REPORTS & OPTIONS

Household Income | $0-10k
Population
Families and Households
Female Fertility
Female Fertility (Unmarried)
Race (Community Size)
Race (Percentage)
Ancestry (Community Size)
AfghanAfricanAlaska NativeAlaskan AthabascanAlbanianAleutAlsatianAmericanApacheArabArapahoArgentineanArmenianAssyrian / Chaldean / SyriacAustralianAustrianBahamianBangladeshiBarbadianBasqueBelgianBelizeanBermudanBhutaneseBlackfeetBolivianBrazilianBritishBritish West IndianBulgarianBurmeseCajunCambodianCanadianCape VerdeanCarpatho RusynCelticCentral AmericanCentral American IndianCherokeeCheyenneChickasawChileanChineseChippewaChoctawColombianColvilleComancheCosta RicanCreeCreekCroatianCrowCubanCypriotCzechCzechoslovakianDanishDelawareDominicanDutchDutch West IndianEastern EuropeanEcuadorianEgyptianEnglishEstonianEthiopianEuropeanFijianFilipinoFinnishFrenchFrench American IndianFrench CanadianGermanGerman RussianGhanaianGreekGuamanian / ChamorroGuatemalanGuyaneseHaitianHmongHonduranHopiHoumaHungarianIcelanderIndian (Asian)IndonesianInupiatIranianIraqiIrishIroquoisIsraeliItalianJamaicanJapaneseJordanianKenyanKiowaKoreanLaotianLatvianLebaneseLiberianLithuanianLumbeeLuxembourgerMacedonianMalaysianMalteseMarshalleseMenomineeMexicanMexican American IndianMongolianMoroccanNative HawaiianNavajoNepaleseNew ZealanderNicaraguanNigerianNorthern EuropeanNorwegianOkinawanOsageOttawaPaiutePakistaniPalestinianPanamanianParaguayanPennsylvania GermanPeruvianPimaPolishPortuguesePotawatomiPuebloPuerto RicanPuget Sound SalishRomanianRussianSalvadoranSamoanScandinavianScotch-IrishScottishSeminoleSenegaleseSerbianShoshoneSierra LeoneanSiouxSlavicSlovakSloveneSomaliSouth AfricanSouth AmericanSouth American IndianSoviet UnionSpaniardSpanishSpanish AmericanSpanish American IndianSri LankanSubsaharan AfricanSudaneseSwedishSwissSyrianTaiwaneseThaiTlingit-HaidaTohono O'OdhamTonganTrinidadian and TobagonianTsimshianTurkishU.S. Virgin IslanderUgandanUkrainianUruguayanUteVenezuelanVietnameseWelshWest IndianYakamaYaquiYugoslavianYumanYup'ikZimbabwean
Ancestry (Percentage)
AfghanAfricanAlaska NativeAlaskan AthabascanAlbanianAleutAlsatianAmericanApacheArabArapahoArgentineanArmenianAssyrian / Chaldean / SyriacAustralianAustrianBahamianBangladeshiBarbadianBasqueBelgianBelizeanBermudanBhutaneseBlackfeetBolivianBrazilianBritishBritish West IndianBulgarianBurmeseCajunCambodianCanadianCape VerdeanCarpatho RusynCelticCentral AmericanCentral American IndianCherokeeCheyenneChickasawChileanChineseChippewaChoctawColombianColvilleComancheCosta RicanCreeCreekCroatianCrowCubanCypriotCzechCzechoslovakianDanishDelawareDominicanDutchDutch West IndianEastern EuropeanEcuadorianEgyptianEnglishEstonianEthiopianEuropeanFijianFilipinoFinnishFrenchFrench American IndianFrench CanadianGermanGerman RussianGhanaianGreekGuamanian / ChamorroGuatemalanGuyaneseHaitianHmongHonduranHopiHoumaHungarianIcelanderIndian (Asian)IndonesianInupiatIranianIraqiIrishIroquoisIsraeliItalianJamaicanJapaneseJordanianKenyanKiowaKoreanLaotianLatvianLebaneseLiberianLithuanianLumbeeLuxembourgerMacedonianMalaysianMalteseMarshalleseMenomineeMexicanMexican American IndianMongolianMoroccanNative HawaiianNavajoNepaleseNew ZealanderNicaraguanNigerianNorthern EuropeanNorwegianOkinawanOsageOttawaPaiutePakistaniPalestinianPanamanianParaguayanPennsylvania GermanPeruvianPimaPolishPortuguesePotawatomiPuebloPuerto RicanPuget Sound SalishRomanianRussianSalvadoranSamoanScandinavianScotch-IrishScottishSeminoleSenegaleseSerbianShoshoneSierra LeoneanSiouxSlavicSlovakSloveneSomaliSouth AfricanSouth AmericanSouth American IndianSoviet UnionSpaniardSpanishSpanish AmericanSpanish American IndianSri LankanSubsaharan AfricanSudaneseSwedishSwissSyrianTaiwaneseThaiTlingit-HaidaTohono O'OdhamTonganTrinidadian and TobagonianTsimshianTurkishU.S. Virgin IslanderUgandanUkrainianUruguayanUteVenezuelanVietnameseWelshWest IndianYakamaYaquiYugoslavianYumanYup'ikZimbabwean
Immigrant Origin (Total)
AfghanistanAfricaAlbaniaArgentinaArmeniaAsiaAustraliaAustriaAzoresBahamasBangladeshBarbadosBelarusBelgiumBelizeBoliviaBosnia and HerzegovinaBrazilBulgariaBurma / MyanmarCabo VerdeCambodiaCameroonCanadaCaribbeanCentral AmericaChileChinaColombiaCongoCosta RicaCroatiaCubaCzechoslovakiaDenmarkDominicaDominican RepublicEastern AfricaEastern AsiaEastern EuropeEcuadorEgyptEl SalvadorEnglandEritreaEthiopiaEuropeFijiFranceGermanyGhanaGreeceGrenadaGuatemalaGuyanaHaitiHondurasHong KongHungaryIndiaIndonesiaIranIraqIrelandIsraelItalyJamaicaJapanJordanKazakhstanKenyaKoreaKuwaitLaosLatin AmericaLatviaLebanonLiberiaLithuaniaMalaysiaMexicoMicronesiaMiddle AfricaMoldovaMoroccoNepalNetherlandsNicaraguaNigeriaNorth MacedoniaNorthern AfricaNorthern EuropeNorwayOceaniaPakistanPanamaPeruPhilippinesPolandPortugalRomaniaRussiaSaudi ArabiaScotlandSenegalSerbiaSierra LeoneSingaporeSomaliaSouth AfricaSouth AmericaSouth Central AsiaSouth Eastern AsiaSouthern EuropeSpainSri LankaSt. Vincent and the GrenadinesSudanSwedenSwitzerlandSyriaTaiwanThailandTrinidad and TobagoTurkeyUgandaUkraineUruguayUzbekistanVenezuelaVietnamWest IndiesWestern AfricaWestern AsiaWestern EuropeYemenZaireZimbabwe
Immigrant Origin (Percentage)
AfghanistanAfricaAlbaniaArgentinaArmeniaAsiaAustraliaAustriaAzoresBahamasBangladeshBarbadosBelarusBelgiumBelizeBoliviaBosnia and HerzegovinaBrazilBulgariaBurma / MyanmarCabo VerdeCambodiaCameroonCanadaCaribbeanCentral AmericaChileChinaColombiaCongoCosta RicaCroatiaCubaCzechoslovakiaDenmarkDominicaDominican RepublicEastern AfricaEastern AsiaEastern EuropeEcuadorEgyptEl SalvadorEnglandEritreaEthiopiaEuropeFijiFranceGermanyGhanaGreeceGrenadaGuatemalaGuyanaHaitiHondurasHong KongHungaryIndiaIndonesiaIranIraqIrelandIsraelItalyJamaicaJapanJordanKazakhstanKenyaKoreaKuwaitLaosLatin AmericaLatviaLebanonLiberiaLithuaniaMalaysiaMexicoMicronesiaMiddle AfricaMoldovaMoroccoNepalNetherlandsNicaraguaNigeriaNorth MacedoniaNorthern AfricaNorthern EuropeNorwayOceaniaPakistanPanamaPeruPhilippinesPolandPortugalRomaniaRussiaSaudi ArabiaScotlandSenegalSerbiaSierra LeoneSingaporeSomaliaSouth AfricaSouth AmericaSouth Central AsiaSouth Eastern AsiaSouthern EuropeSpainSri LankaSt. Vincent and the GrenadinesSudanSwedenSwitzerlandSyriaTaiwanThailandTrinidad and TobagoTurkeyUgandaUkraineUruguayUzbekistanVenezuelaVietnamWest IndiesWestern AfricaWestern AsiaWestern EuropeYemenZaireZimbabwe
Income
Income (Families)
Income (Households)
Poverty
Poverty (Families)
Unemployment
Employment Occupations
Employment Industries
Employer Class
Commute Time
Commute Means
School Enrollment
Education by Degree Field
Occupancy
Finances
Physical Characteristics
Rhode Island
Compare Zip Codes
Comparison Subject

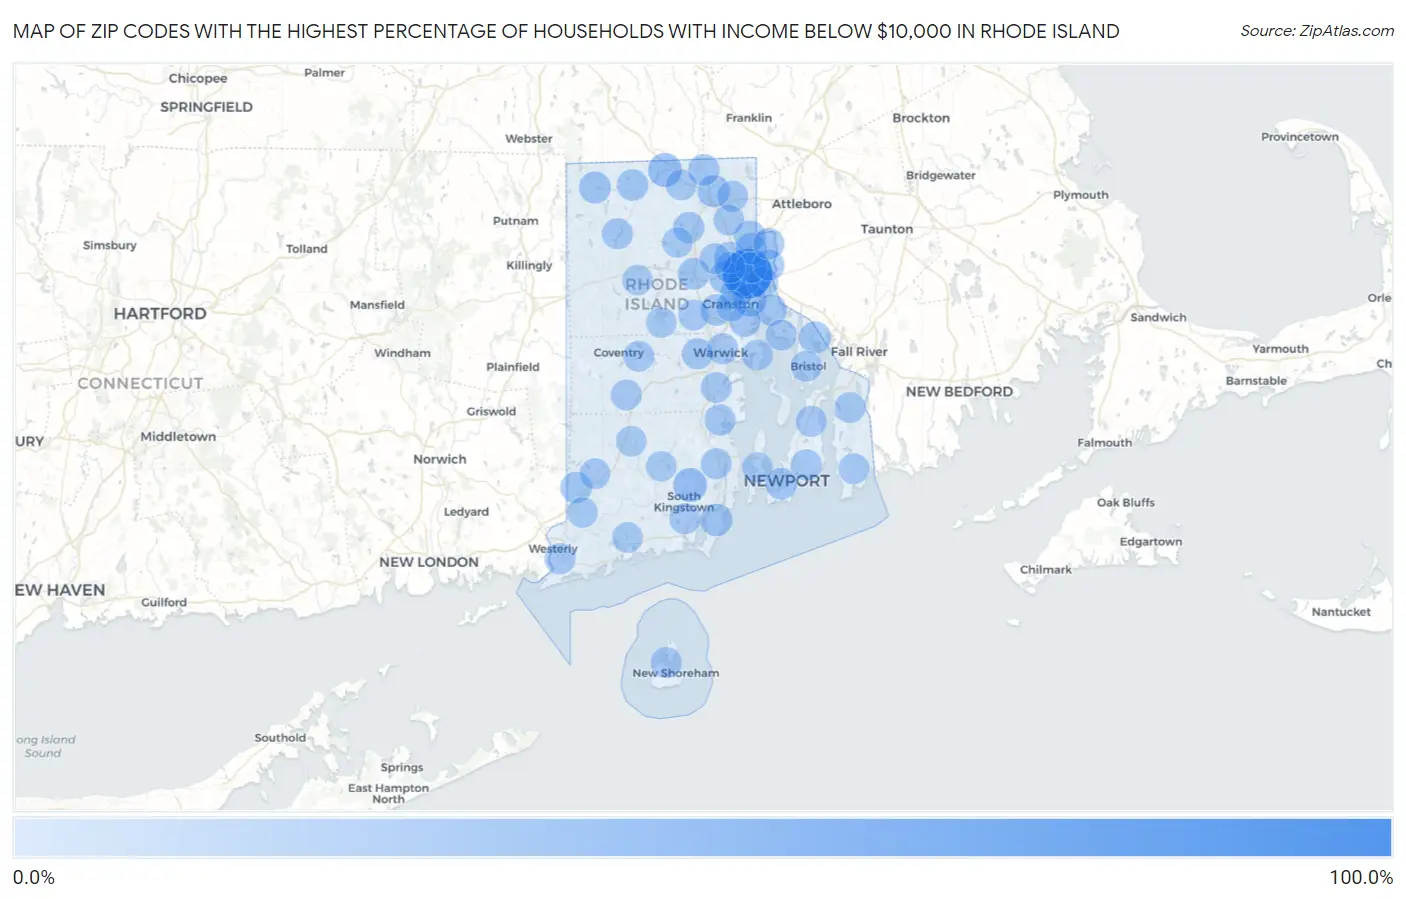
Map of Zip Codes with the Highest Percentage of Households with Income Below $10,000 in Rhode Island

0.0%
100.0%
Zip Codes with the Highest Percentage of Households with Income Below $10,000 in Rhode Island Map

Zip Codes with the Highest Percentage of Households with Income Below $10,000 in Rhode Island

Zip Code Households with Income < $10k vs State vs National
1.02912100.0%4.6%(+95.4)#14.9%(+95.1)#2
2.0287618.1%4.6%(+13.5)#24.9%(+13.2)#1,014
3.0288117.5%4.6%(+12.9)#34.9%(+12.6)#1,090
4.0290512.9%4.6%(+8.30)#44.9%(+8.00)#2,109
5.0290310.6%4.6%(+6.00)#54.9%(+5.70)#3,179
6.0288210.0%4.6%(+5.40)#64.9%(+5.10)#3,577
7.028388.8%4.6%(+4.20)#74.9%(+3.90)#4,654
8.028858.5%4.6%(+3.90)#84.9%(+3.60)#4,940
9.028598.1%4.6%(+3.50)#94.9%(+3.20)#5,453
10.029078.0%4.6%(+3.40)#104.9%(+3.10)#5,555
11.029096.8%4.6%(+2.20)#114.9%(+1.90)#7,301
12.029046.6%4.6%(+2.00)#124.9%(+1.70)#7,720
13.029196.4%4.6%(+1.80)#134.9%(+1.50)#8,115
14.028306.4%4.6%(+1.80)#144.9%(+1.50)#8,189
15.028406.0%4.6%(+1.40)#154.9%(+1.10)#9,008
16.028605.9%4.6%(+1.30)#164.9%(+1.00)#9,198
17.028955.7%4.6%(+1.10)#174.9%(+0.800)#9,699
18.028335.6%4.6%(+1.000)#184.9%(+0.700)#10,143
19.029205.5%4.6%(+0.900)#194.9%(+0.600)#10,213
20.028635.4%4.6%(+0.800)#204.9%(+0.500)#10,488
21.029145.0%4.6%(+0.400)#214.9%(+0.100)#11,714
22.029064.8%4.6%(+0.200)#224.9%(-0.100)#12,330
23.029174.8%4.6%(+0.200)#234.9%(-0.100)#12,376
24.028424.5%4.6%(-0.100)#244.9%(-0.400)#13,412
25.029084.4%4.6%(-0.200)#254.9%(-0.500)#13,680
26.029154.4%4.6%(-0.200)#264.9%(-0.500)#13,760
27.029164.2%4.6%(-0.400)#274.9%(-0.700)#14,588
28.028884.1%4.6%(-0.500)#284.9%(-0.800)#14,906
29.028614.0%4.6%(-0.600)#294.9%(-0.900)#15,262
30.028524.0%4.6%(-0.600)#304.9%(-0.900)#15,278
31.028933.6%4.6%(-1.000)#314.9%(-1.30)#16,840
32.028143.6%4.6%(-1.000)#324.9%(-1.30)#16,963
33.028913.4%4.6%(-1.20)#334.9%(-1.50)#17,709
34.029113.4%4.6%(-1.20)#344.9%(-1.50)#17,741
35.028713.3%4.6%(-1.30)#354.9%(-1.60)#18,152
36.028863.2%4.6%(-1.40)#364.9%(-1.70)#18,502
37.028793.0%4.6%(-1.60)#374.9%(-1.90)#19,393
38.028783.0%4.6%(-1.60)#384.9%(-1.90)#19,430
39.028642.9%4.6%(-1.70)#394.9%(-2.00)#19,812
40.028072.9%4.6%(-1.70)#404.9%(-2.00)#20,142
41.028742.8%4.6%(-1.80)#414.9%(-2.10)#20,410
42.028162.7%4.6%(-1.90)#424.9%(-2.20)#20,696
43.028892.7%4.6%(-1.90)#434.9%(-2.20)#20,717
44.028172.7%4.6%(-1.90)#444.9%(-2.20)#20,829
45.029212.6%4.6%(-2.00)#454.9%(-2.30)#21,213
46.028962.5%4.6%(-2.10)#464.9%(-2.40)#21,667
47.028182.4%4.6%(-2.20)#474.9%(-2.50)#22,068
48.028092.3%4.6%(-2.30)#484.9%(-2.60)#22,476
49.028652.3%4.6%(-2.30)#494.9%(-2.60)#22,498
50.028062.2%4.6%(-2.40)#504.9%(-2.70)#22,918
51.028371.9%4.6%(-2.70)#514.9%(-3.00)#24,149
52.028321.6%4.6%(-3.00)#524.9%(-3.30)#25,198
53.029101.3%4.6%(-3.30)#534.9%(-3.60)#26,021
54.028921.1%4.6%(-3.50)#544.9%(-3.80)#26,597
55.028221.0%4.6%(-3.60)#554.9%(-3.90)#26,843
56.028130.90%4.6%(-3.70)#564.9%(-4.00)#27,061
57.028570.80%4.6%(-3.80)#574.9%(-4.10)#27,288
58.028310.80%4.6%(-3.80)#584.9%(-4.10)#27,328
59.028040.70%4.6%(-3.90)#594.9%(-4.20)#27,560
60.028280.60%4.6%(-4.00)#604.9%(-4.30)#27,701
61.028350.50%4.6%(-4.10)#614.9%(-4.40)#27,883

Common Questions

What are the Top 10 Zip Codes with the Highest Percentage of Households with Income Below $10,000 in Rhode Island?
Top 10 Zip Codes with the Highest Percentage of Households with Income Below $10,000 in Rhode Island are:
#1
100.0%
#2
18.1%
#3
17.5%
#4
12.9%
#5
10.6%
#6
10.0%
#7
8.8%
#8
8.5%
#9
8.1%
#10
8.0%
What zip code has the Highest Percentage of Households with Income Below $10,000 in Rhode Island?
02912 has the Highest Percentage of Households with Income Below $10,000 in Rhode Island with 100.0%.
What is the Percentage of Households with Income Below $10,000 in the State of Rhode Island?
Percentage of Households with Income Below $10,000 in Rhode Island is 4.6%.
What is the Percentage of Households with Income Below $10,000 in the United States?
Percentage of Households with Income Below $10,000 in the United States is 4.9%.