Zip Codes with the Highest Percentage of Population Employed in Real Estate, Rental & Leasing in Arizona
RELATED REPORTS & OPTIONS
Real Estate, Rental & Leasing
Arizona
Compare Zip Codes
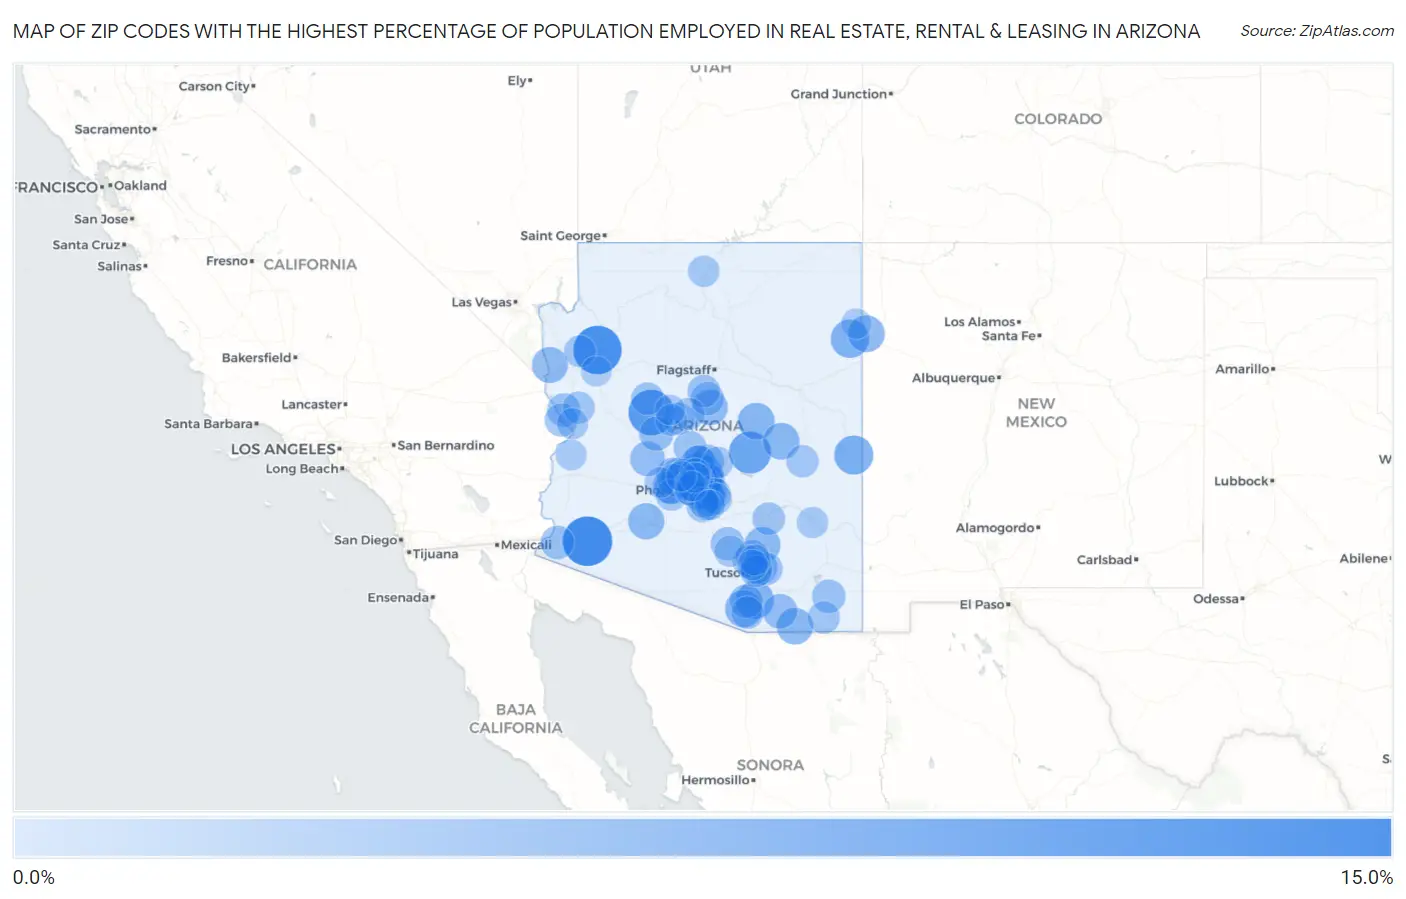
Map of Zip Codes with the Highest Percentage of Population Employed in Real Estate, Rental & Leasing in Arizona
0.0%
15.0%
Zip Codes with the Highest Percentage of Population Employed in Real Estate, Rental & Leasing in Arizona
| Zip Code | % Employed | vs State | vs National | |
| 1. | 85352 | 11.7% | 2.4%(+9.27)#1 | 1.9%(+9.78)#273 |
| 2. | 86411 | 11.1% | 2.4%(+8.71)#2 | 1.9%(+9.22)#302 |
| 3. | 86338 | 9.8% | 2.4%(+7.40)#3 | 1.9%(+7.91)#395 |
| 4. | 85554 | 8.2% | 2.4%(+5.81)#4 | 1.9%(+6.33)#527 |
| 5. | 85932 | 6.8% | 2.4%(+4.41)#5 | 1.9%(+4.93)#763 |
| 6. | 85258 | 6.6% | 2.4%(+4.19)#6 | 1.9%(+4.70)#801 |
| 7. | 86511 | 6.5% | 2.4%(+4.07)#7 | 1.9%(+4.59)#827 |
| 8. | 85614 | 6.3% | 2.4%(+3.85)#8 | 1.9%(+4.37)#892 |
| 9. | 85250 | 6.0% | 2.4%(+3.64)#9 | 1.9%(+4.15)#960 |
| 10. | 85645 | 6.0% | 2.4%(+3.56)#10 | 1.9%(+4.07)#989 |
| 11. | 85255 | 5.9% | 2.4%(+3.49)#11 | 1.9%(+4.00)#1,012 |
| 12. | 86515 | 5.8% | 2.4%(+3.39)#12 | 1.9%(+3.91)#1,044 |
| 13. | 85931 | 5.8% | 2.4%(+3.36)#13 | 1.9%(+3.88)#1,048 |
| 14. | 85911 | 5.7% | 2.4%(+3.28)#14 | 1.9%(+3.79)#1,082 |
| 15. | 85018 | 5.6% | 2.4%(+3.24)#15 | 1.9%(+3.75)#1,099 |
| 16. | 85377 | 5.6% | 2.4%(+3.23)#16 | 1.9%(+3.75)#1,104 |
| 17. | 85615 | 5.6% | 2.4%(+3.23)#17 | 1.9%(+3.74)#1,105 |
| 18. | 85337 | 5.5% | 2.4%(+3.08)#18 | 1.9%(+3.59)#1,155 |
| 19. | 85623 | 5.4% | 2.4%(+3.01)#19 | 1.9%(+3.52)#1,194 |
| 20. | 86429 | 5.3% | 2.4%(+2.94)#20 | 1.9%(+3.45)#1,221 |
| 21. | 85259 | 5.3% | 2.4%(+2.86)#21 | 1.9%(+3.37)#1,262 |
| 22. | 85257 | 5.2% | 2.4%(+2.84)#22 | 1.9%(+3.35)#1,270 |
| 23. | 86335 | 5.2% | 2.4%(+2.79)#23 | 1.9%(+3.30)#1,287 |
| 24. | 85012 | 5.0% | 2.4%(+2.55)#24 | 1.9%(+3.06)#1,425 |
| 25. | 85375 | 4.8% | 2.4%(+2.42)#25 | 1.9%(+2.94)#1,486 |
| 26. | 85390 | 4.8% | 2.4%(+2.42)#26 | 1.9%(+2.93)#1,491 |
| 27. | 85611 | 4.8% | 2.4%(+2.37)#27 | 1.9%(+2.88)#1,522 |
| 28. | 85340 | 4.7% | 2.4%(+2.33)#28 | 1.9%(+2.85)#1,532 |
| 29. | 85750 | 4.7% | 2.4%(+2.29)#29 | 1.9%(+2.81)#1,567 |
| 30. | 86332 | 4.6% | 2.4%(+2.20)#30 | 1.9%(+2.71)#1,639 |
| 31. | 85351 | 4.6% | 2.4%(+2.17)#31 | 1.9%(+2.69)#1,656 |
| 32. | 85266 | 4.3% | 2.4%(+1.93)#32 | 1.9%(+2.44)#1,844 |
| 33. | 85395 | 4.3% | 2.4%(+1.88)#33 | 1.9%(+2.39)#1,879 |
| 34. | 85373 | 4.3% | 2.4%(+1.86)#34 | 1.9%(+2.38)#1,892 |
| 35. | 85367 | 4.3% | 2.4%(+1.86)#35 | 1.9%(+2.37)#1,895 |
| 36. | 85622 | 4.3% | 2.4%(+1.85)#36 | 1.9%(+2.37)#1,904 |
| 37. | 85625 | 4.2% | 2.4%(+1.80)#37 | 1.9%(+2.32)#1,949 |
| 38. | 86404 | 4.2% | 2.4%(+1.78)#38 | 1.9%(+2.29)#1,979 |
| 39. | 85262 | 4.2% | 2.4%(+1.78)#39 | 1.9%(+2.29)#1,980 |
| 40. | 85141 | 4.2% | 2.4%(+1.76)#40 | 1.9%(+2.27)#1,995 |
| 41. | 86351 | 4.1% | 2.4%(+1.66)#41 | 1.9%(+2.18)#2,097 |
| 42. | 86403 | 4.1% | 2.4%(+1.66)#42 | 1.9%(+2.17)#2,101 |
| 43. | 85014 | 4.0% | 2.4%(+1.63)#43 | 1.9%(+2.15)#2,125 |
| 44. | 85755 | 4.0% | 2.4%(+1.61)#44 | 1.9%(+2.13)#2,146 |
| 45. | 85324 | 4.0% | 2.4%(+1.58)#45 | 1.9%(+2.09)#2,189 |
| 46. | 85749 | 3.9% | 2.4%(+1.51)#46 | 1.9%(+2.02)#2,270 |
| 47. | 86305 | 3.9% | 2.4%(+1.49)#47 | 1.9%(+2.00)#2,287 |
| 48. | 86336 | 3.9% | 2.4%(+1.48)#48 | 1.9%(+2.00)#2,288 |
| 49. | 85260 | 3.9% | 2.4%(+1.47)#49 | 1.9%(+1.99)#2,300 |
| 50. | 85192 | 3.9% | 2.4%(+1.46)#50 | 1.9%(+1.97)#2,315 |
| 51. | 85718 | 3.8% | 2.4%(+1.39)#51 | 1.9%(+1.91)#2,390 |
| 52. | 85253 | 3.8% | 2.4%(+1.38)#52 | 1.9%(+1.89)#2,403 |
| 53. | 85268 | 3.8% | 2.4%(+1.37)#53 | 1.9%(+1.88)#2,413 |
| 54. | 85646 | 3.8% | 2.4%(+1.37)#54 | 1.9%(+1.88)#2,417 |
| 55. | 85308 | 3.7% | 2.4%(+1.32)#55 | 1.9%(+1.84)#2,476 |
| 56. | 85941 | 3.7% | 2.4%(+1.32)#56 | 1.9%(+1.83)#2,491 |
| 57. | 85617 | 3.7% | 2.4%(+1.30)#57 | 1.9%(+1.81)#2,512 |
| 58. | 86329 | 3.6% | 2.4%(+1.24)#58 | 1.9%(+1.75)#2,589 |
| 59. | 85248 | 3.6% | 2.4%(+1.21)#59 | 1.9%(+1.72)#2,653 |
| 60. | 86438 | 3.6% | 2.4%(+1.19)#60 | 1.9%(+1.71)#2,674 |
| 61. | 85742 | 3.6% | 2.4%(+1.18)#61 | 1.9%(+1.70)#2,689 |
| 62. | 85295 | 3.6% | 2.4%(+1.17)#62 | 1.9%(+1.69)#2,702 |
| 63. | 85251 | 3.6% | 2.4%(+1.16)#63 | 1.9%(+1.67)#2,731 |
| 64. | 85379 | 3.6% | 2.4%(+1.15)#64 | 1.9%(+1.67)#2,742 |
| 65. | 85205 | 3.5% | 2.4%(+1.12)#65 | 1.9%(+1.63)#2,800 |
| 66. | 86409 | 3.5% | 2.4%(+1.11)#66 | 1.9%(+1.63)#2,804 |
| 67. | 85004 | 3.5% | 2.4%(+1.10)#67 | 1.9%(+1.61)#2,840 |
| 68. | 85716 | 3.5% | 2.4%(+1.08)#68 | 1.9%(+1.60)#2,862 |
| 69. | 86327 | 3.5% | 2.4%(+1.08)#69 | 1.9%(+1.60)#2,863 |
| 70. | 86303 | 3.4% | 2.4%(+1.04)#70 | 1.9%(+1.55)#2,943 |
| 71. | 85028 | 3.4% | 2.4%(+1.03)#71 | 1.9%(+1.54)#2,965 |
| 72. | 85015 | 3.4% | 2.4%(+1.02)#72 | 1.9%(+1.53)#2,982 |
| 73. | 85331 | 3.4% | 2.4%(+1.01)#73 | 1.9%(+1.52)#2,990 |
| 74. | 85283 | 3.4% | 2.4%(+1.01)#74 | 1.9%(+1.52)#2,998 |
| 75. | 85263 | 3.4% | 2.4%(+0.969)#75 | 1.9%(+1.48)#3,079 |
| 76. | 85338 | 3.4% | 2.4%(+0.950)#76 | 1.9%(+1.46)#3,123 |
| 77. | 85208 | 3.3% | 2.4%(+0.939)#77 | 1.9%(+1.45)#3,140 |
| 78. | 86036 | 3.3% | 2.4%(+0.901)#78 | 1.9%(+1.41)#3,196 |
| 79. | 85234 | 3.3% | 2.4%(+0.893)#79 | 1.9%(+1.41)#3,213 |
| 80. | 85212 | 3.3% | 2.4%(+0.871)#80 | 1.9%(+1.38)#3,266 |
| 81. | 85543 | 3.3% | 2.4%(+0.863)#81 | 1.9%(+1.38)#3,285 |
| 82. | 85145 | 3.3% | 2.4%(+0.847)#82 | 1.9%(+1.36)#3,314 |
| 83. | 85254 | 3.2% | 2.4%(+0.840)#83 | 1.9%(+1.35)#3,334 |
| 84. | 86406 | 3.2% | 2.4%(+0.829)#84 | 1.9%(+1.34)#3,343 |
| 85. | 85050 | 3.2% | 2.4%(+0.770)#85 | 1.9%(+1.28)#3,470 |
| 86. | 85003 | 3.1% | 2.4%(+0.700)#86 | 1.9%(+1.21)#3,614 |
| 87. | 85013 | 3.1% | 2.4%(+0.696)#87 | 1.9%(+1.21)#3,620 |
| 88. | 85737 | 3.1% | 2.4%(+0.683)#88 | 1.9%(+1.20)#3,659 |
| 89. | 85249 | 3.0% | 2.4%(+0.613)#89 | 1.9%(+1.13)#3,849 |
| 90. | 85396 | 3.0% | 2.4%(+0.603)#90 | 1.9%(+1.12)#3,889 |
| 91. | 85704 | 3.0% | 2.4%(+0.581)#91 | 1.9%(+1.09)#3,948 |
| 92. | 85344 | 3.0% | 2.4%(+0.579)#92 | 1.9%(+1.09)#3,951 |
| 93. | 86401 | 2.9% | 2.4%(+0.542)#93 | 1.9%(+1.05)#4,045 |
| 94. | 86301 | 2.9% | 2.4%(+0.517)#94 | 1.9%(+1.03)#4,105 |
| 95. | 85286 | 2.9% | 2.4%(+0.495)#95 | 1.9%(+1.01)#4,172 |
| 96. | 85032 | 2.9% | 2.4%(+0.453)#96 | 1.9%(+0.965)#4,285 |
| 97. | 86504 | 2.8% | 2.4%(+0.437)#97 | 1.9%(+0.949)#4,322 |
| 98. | 85016 | 2.8% | 2.4%(+0.435)#98 | 1.9%(+0.947)#4,327 |
| 99. | 85298 | 2.8% | 2.4%(+0.429)#99 | 1.9%(+0.941)#4,344 |
| 100. | 85382 | 2.8% | 2.4%(+0.426)#100 | 1.9%(+0.939)#4,353 |
Common Questions
What are the Top 10 Zip Codes with the Highest Percentage of Population Employed in Real Estate, Rental & Leasing in Arizona?
Top 10 Zip Codes with the Highest Percentage of Population Employed in Real Estate, Rental & Leasing in Arizona are:
What zip code has the Highest Percentage of Population Employed in Real Estate, Rental & Leasing in Arizona?
85352 has the Highest Percentage of Population Employed in Real Estate, Rental & Leasing in Arizona with 11.7%.
What is the Percentage of Population Employed in Real Estate, Rental & Leasing in the State of Arizona?
Percentage of Population Employed in Real Estate, Rental & Leasing in Arizona is 2.4%.
What is the Percentage of Population Employed in Real Estate, Rental & Leasing in the United States?
Percentage of Population Employed in Real Estate, Rental & Leasing in the United States is 1.9%.