Zip Codes with the Highest Percentage of Population Employed in Real Estate, Rental & Leasing in Nevada
RELATED REPORTS & OPTIONS
Real Estate, Rental & Leasing
Nevada
Compare Zip Codes
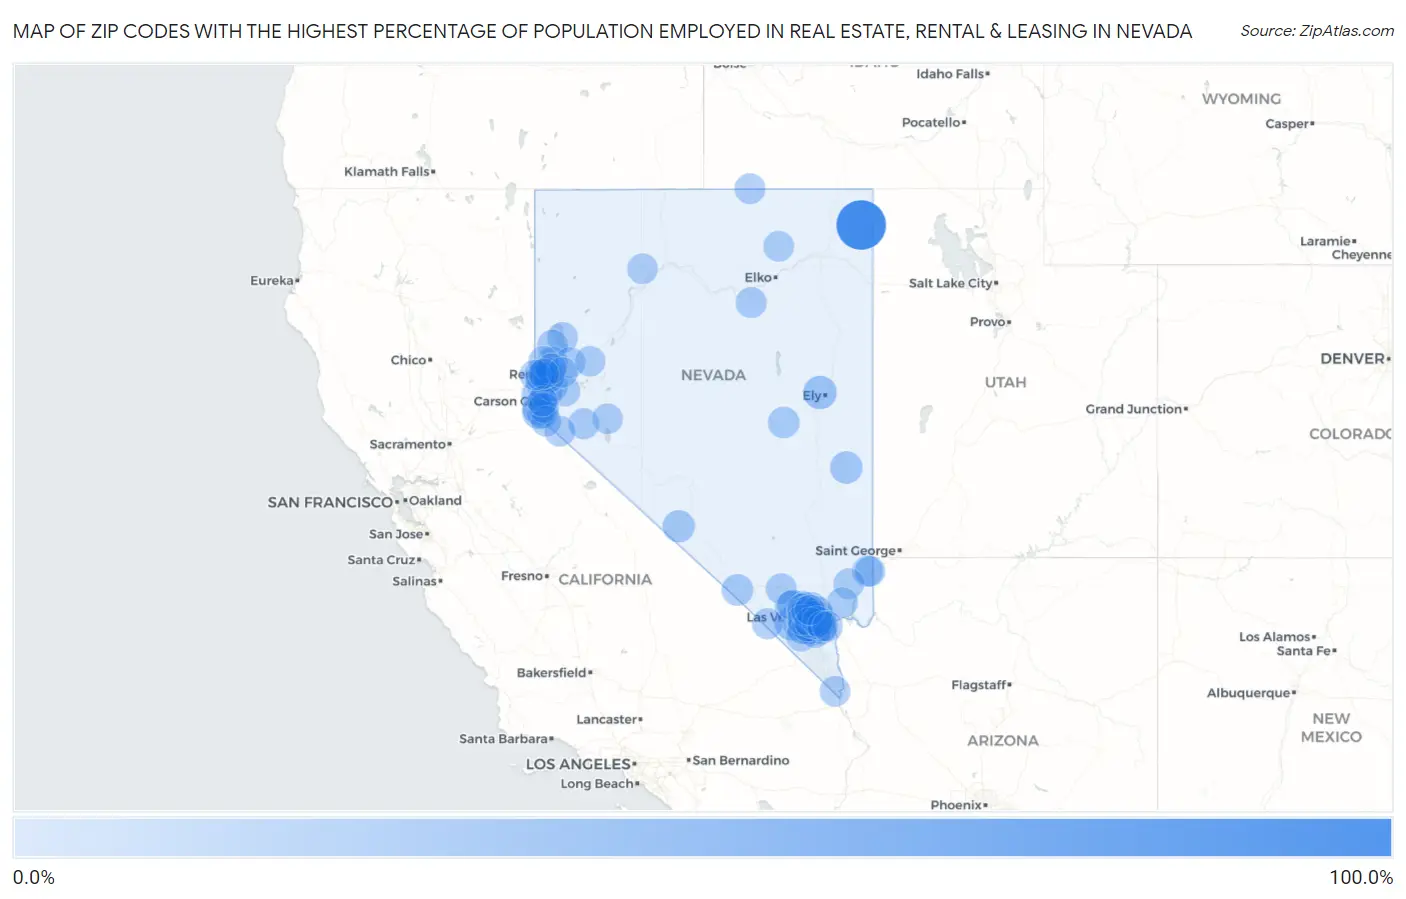
Map of Zip Codes with the Highest Percentage of Population Employed in Real Estate, Rental & Leasing in Nevada
0.0%
100.0%
Zip Codes with the Highest Percentage of Population Employed in Real Estate, Rental & Leasing in Nevada
| Zip Code | % Employed | vs State | vs National | |
| 1. | 89830 | 100.0% | 2.5%(+97.5)#1 | 1.9%(+98.1)#4 |
| 2. | 89319 | 16.7% | 2.5%(+14.2)#2 | 1.9%(+14.8)#143 |
| 3. | 89161 | 15.7% | 2.5%(+13.2)#3 | 1.9%(+13.8)#156 |
| 4. | 89448 | 14.3% | 2.5%(+11.9)#4 | 1.9%(+12.4)#189 |
| 5. | 89413 | 13.8% | 2.5%(+11.3)#5 | 1.9%(+11.9)#211 |
| 6. | 89124 | 13.2% | 2.5%(+10.7)#6 | 1.9%(+11.3)#221 |
| 7. | 89158 | 13.0% | 2.5%(+10.5)#7 | 1.9%(+11.1)#227 |
| 8. | 89043 | 11.6% | 2.5%(+9.12)#8 | 1.9%(+9.69)#280 |
| 9. | 89013 | 10.0% | 2.5%(+7.53)#9 | 1.9%(+8.11)#383 |
| 10. | 89109 | 7.8% | 2.5%(+5.36)#10 | 1.9%(+5.94)#579 |
| 11. | 89020 | 7.6% | 2.5%(+5.14)#11 | 1.9%(+5.72)#616 |
| 12. | 89411 | 7.6% | 2.5%(+5.14)#12 | 1.9%(+5.71)#617 |
| 13. | 89451 | 6.9% | 2.5%(+4.47)#13 | 1.9%(+5.04)#741 |
| 14. | 89314 | 6.6% | 2.5%(+4.11)#14 | 1.9%(+4.69)#806 |
| 15. | 89135 | 5.0% | 2.5%(+2.50)#15 | 1.9%(+3.08)#1,406 |
| 16. | 89138 | 4.5% | 2.5%(+2.00)#16 | 1.9%(+2.58)#1,741 |
| 17. | 89143 | 4.4% | 2.5%(+1.95)#17 | 1.9%(+2.53)#1,775 |
| 18. | 89034 | 4.3% | 2.5%(+1.82)#18 | 1.9%(+2.40)#1,869 |
| 19. | 89134 | 4.3% | 2.5%(+1.81)#19 | 1.9%(+2.39)#1,878 |
| 20. | 89704 | 4.2% | 2.5%(+1.71)#20 | 1.9%(+2.29)#1,976 |
| 21. | 89447 | 4.1% | 2.5%(+1.63)#21 | 1.9%(+2.21)#2,061 |
| 22. | 89822 | 4.1% | 2.5%(+1.62)#22 | 1.9%(+2.20)#2,073 |
| 23. | 89148 | 4.0% | 2.5%(+1.49)#23 | 1.9%(+2.07)#2,224 |
| 24. | 89144 | 4.0% | 2.5%(+1.48)#24 | 1.9%(+2.06)#2,238 |
| 25. | 89074 | 3.9% | 2.5%(+1.46)#25 | 1.9%(+2.04)#2,251 |
| 26. | 89018 | 3.8% | 2.5%(+1.38)#26 | 1.9%(+1.95)#2,330 |
| 27. | 89511 | 3.8% | 2.5%(+1.37)#27 | 1.9%(+1.94)#2,348 |
| 28. | 89012 | 3.8% | 2.5%(+1.29)#28 | 1.9%(+1.87)#2,430 |
| 29. | 89107 | 3.8% | 2.5%(+1.28)#29 | 1.9%(+1.86)#2,446 |
| 30. | 89441 | 3.7% | 2.5%(+1.27)#30 | 1.9%(+1.85)#2,460 |
| 31. | 89061 | 3.7% | 2.5%(+1.24)#31 | 1.9%(+1.82)#2,494 |
| 32. | 89166 | 3.7% | 2.5%(+1.24)#32 | 1.9%(+1.82)#2,496 |
| 33. | 89052 | 3.4% | 2.5%(+0.936)#33 | 1.9%(+1.51)#3,013 |
| 34. | 89084 | 3.4% | 2.5%(+0.920)#34 | 1.9%(+1.50)#3,047 |
| 35. | 89104 | 3.2% | 2.5%(+0.769)#35 | 1.9%(+1.35)#3,338 |
| 36. | 89156 | 3.2% | 2.5%(+0.749)#36 | 1.9%(+1.33)#3,378 |
| 37. | 89521 | 3.2% | 2.5%(+0.697)#37 | 1.9%(+1.28)#3,482 |
| 38. | 89145 | 3.2% | 2.5%(+0.694)#38 | 1.9%(+1.27)#3,491 |
| 39. | 89424 | 3.2% | 2.5%(+0.688)#39 | 1.9%(+1.27)#3,507 |
| 40. | 89131 | 3.1% | 2.5%(+0.602)#40 | 1.9%(+1.18)#3,698 |
| 41. | 89146 | 3.1% | 2.5%(+0.596)#41 | 1.9%(+1.17)#3,710 |
| 42. | 89002 | 3.0% | 2.5%(+0.572)#42 | 1.9%(+1.15)#3,777 |
| 43. | 89021 | 3.0% | 2.5%(+0.525)#43 | 1.9%(+1.10)#3,913 |
| 44. | 89431 | 3.0% | 2.5%(+0.515)#44 | 1.9%(+1.09)#3,949 |
| 45. | 89141 | 3.0% | 2.5%(+0.512)#45 | 1.9%(+1.09)#3,953 |
| 46. | 89410 | 3.0% | 2.5%(+0.499)#46 | 1.9%(+1.08)#3,985 |
| 47. | 89801 | 2.9% | 2.5%(+0.430)#47 | 1.9%(+1.01)#4,171 |
| 48. | 89832 | 2.9% | 2.5%(+0.399)#48 | 1.9%(+0.977)#4,251 |
| 49. | 89519 | 2.9% | 2.5%(+0.398)#49 | 1.9%(+0.977)#4,253 |
| 50. | 89044 | 2.8% | 2.5%(+0.329)#50 | 1.9%(+0.908)#4,435 |
| 51. | 89510 | 2.8% | 2.5%(+0.293)#51 | 1.9%(+0.872)#4,537 |
| 52. | 89029 | 2.7% | 2.5%(+0.235)#52 | 1.9%(+0.813)#4,728 |
| 53. | 89117 | 2.7% | 2.5%(+0.231)#53 | 1.9%(+0.809)#4,745 |
| 54. | 89509 | 2.7% | 2.5%(+0.198)#54 | 1.9%(+0.776)#4,865 |
| 55. | 89403 | 2.6% | 2.5%(+0.106)#55 | 1.9%(+0.684)#5,182 |
| 56. | 89183 | 2.6% | 2.5%(+0.105)#56 | 1.9%(+0.683)#5,190 |
| 57. | 89512 | 2.5% | 2.5%(+0.080)#57 | 1.9%(+0.658)#5,288 |
| 58. | 89102 | 2.5% | 2.5%(+0.056)#58 | 1.9%(+0.634)#5,391 |
| 59. | 89128 | 2.5% | 2.5%(+0.006)#59 | 1.9%(+0.585)#5,573 |
| 60. | 89442 | 2.5% | 2.5%(+0.005)#60 | 1.9%(+0.584)#5,575 |
| 61. | 89113 | 2.5% | 2.5%(-0.005)#61 | 1.9%(+0.573)#5,615 |
| 62. | 89502 | 2.5% | 2.5%(-0.020)#62 | 1.9%(+0.559)#5,678 |
| 63. | 89523 | 2.4% | 2.5%(-0.037)#63 | 1.9%(+0.541)#5,747 |
| 64. | 89506 | 2.3% | 2.5%(-0.176)#64 | 1.9%(+0.402)#6,334 |
| 65. | 89129 | 2.3% | 2.5%(-0.188)#65 | 1.9%(+0.390)#6,393 |
| 66. | 89030 | 2.3% | 2.5%(-0.195)#66 | 1.9%(+0.384)#6,424 |
| 67. | 89436 | 2.3% | 2.5%(-0.197)#67 | 1.9%(+0.381)#6,440 |
| 68. | 89705 | 2.3% | 2.5%(-0.211)#68 | 1.9%(+0.367)#6,515 |
| 69. | 89439 | 2.3% | 2.5%(-0.212)#69 | 1.9%(+0.367)#6,519 |
| 70. | 89460 | 2.2% | 2.5%(-0.231)#70 | 1.9%(+0.347)#6,616 |
| 71. | 89121 | 2.2% | 2.5%(-0.232)#71 | 1.9%(+0.347)#6,618 |
| 72. | 89106 | 2.2% | 2.5%(-0.237)#72 | 1.9%(+0.341)#6,646 |
| 73. | 89445 | 2.2% | 2.5%(-0.238)#73 | 1.9%(+0.340)#6,652 |
| 74. | 89427 | 2.2% | 2.5%(-0.242)#74 | 1.9%(+0.337)#6,673 |
| 75. | 89178 | 2.2% | 2.5%(-0.242)#75 | 1.9%(+0.337)#6,674 |
| 76. | 89149 | 2.2% | 2.5%(-0.257)#76 | 1.9%(+0.322)#6,746 |
| 77. | 89142 | 2.2% | 2.5%(-0.268)#77 | 1.9%(+0.310)#6,802 |
| 78. | 89123 | 2.2% | 2.5%(-0.293)#78 | 1.9%(+0.285)#6,920 |
| 79. | 89120 | 2.2% | 2.5%(-0.298)#79 | 1.9%(+0.280)#6,945 |
| 80. | 89179 | 2.1% | 2.5%(-0.332)#80 | 1.9%(+0.246)#7,124 |
| 81. | 89014 | 2.1% | 2.5%(-0.348)#81 | 1.9%(+0.230)#7,203 |
| 82. | 89103 | 2.1% | 2.5%(-0.350)#82 | 1.9%(+0.229)#7,211 |
| 83. | 89108 | 2.1% | 2.5%(-0.354)#83 | 1.9%(+0.224)#7,237 |
| 84. | 89434 | 2.1% | 2.5%(-0.390)#84 | 1.9%(+0.188)#7,424 |
| 85. | 89139 | 2.1% | 2.5%(-0.406)#85 | 1.9%(+0.172)#7,515 |
| 86. | 89101 | 2.1% | 2.5%(-0.414)#86 | 1.9%(+0.164)#7,559 |
| 87. | 89027 | 2.0% | 2.5%(-0.421)#87 | 1.9%(+0.157)#7,597 |
| 88. | 89147 | 2.0% | 2.5%(-0.437)#88 | 1.9%(+0.142)#7,666 |
| 89. | 89040 | 2.0% | 2.5%(-0.450)#89 | 1.9%(+0.128)#7,735 |
| 90. | 89011 | 2.0% | 2.5%(-0.492)#90 | 1.9%(+0.086)#7,967 |
| 91. | 89115 | 2.0% | 2.5%(-0.520)#91 | 1.9%(+0.058)#8,121 |
| 92. | 89130 | 1.9% | 2.5%(-0.527)#92 | 1.9%(+0.051)#8,166 |
| 93. | 89119 | 1.9% | 2.5%(-0.573)#93 | 1.9%(+0.005)#8,490 |
| 94. | 89703 | 1.8% | 2.5%(-0.626)#94 | 1.9%(-0.047)#8,841 |
| 95. | 89122 | 1.8% | 2.5%(-0.628)#95 | 1.9%(-0.050)#8,847 |
| 96. | 89503 | 1.8% | 2.5%(-0.658)#96 | 1.9%(-0.080)#9,039 |
| 97. | 89015 | 1.8% | 2.5%(-0.680)#97 | 1.9%(-0.101)#9,198 |
| 98. | 89031 | 1.8% | 2.5%(-0.713)#98 | 1.9%(-0.135)#9,402 |
| 99. | 89408 | 1.7% | 2.5%(-0.725)#99 | 1.9%(-0.146)#9,477 |
| 100. | 89005 | 1.7% | 2.5%(-0.754)#100 | 1.9%(-0.175)#9,655 |
1
2Common Questions
What are the Top 10 Zip Codes with the Highest Percentage of Population Employed in Real Estate, Rental & Leasing in Nevada?
Top 10 Zip Codes with the Highest Percentage of Population Employed in Real Estate, Rental & Leasing in Nevada are:
What zip code has the Highest Percentage of Population Employed in Real Estate, Rental & Leasing in Nevada?
89830 has the Highest Percentage of Population Employed in Real Estate, Rental & Leasing in Nevada with 100.0%.
What is the Percentage of Population Employed in Real Estate, Rental & Leasing in the State of Nevada?
Percentage of Population Employed in Real Estate, Rental & Leasing in Nevada is 2.5%.
What is the Percentage of Population Employed in Real Estate, Rental & Leasing in the United States?
Percentage of Population Employed in Real Estate, Rental & Leasing in the United States is 1.9%.