Zip Codes with the Highest Percentage of Population Employed in Real Estate, Rental & Leasing in Georgia
RELATED REPORTS & OPTIONS
Real Estate, Rental & Leasing
Georgia
Compare Zip Codes
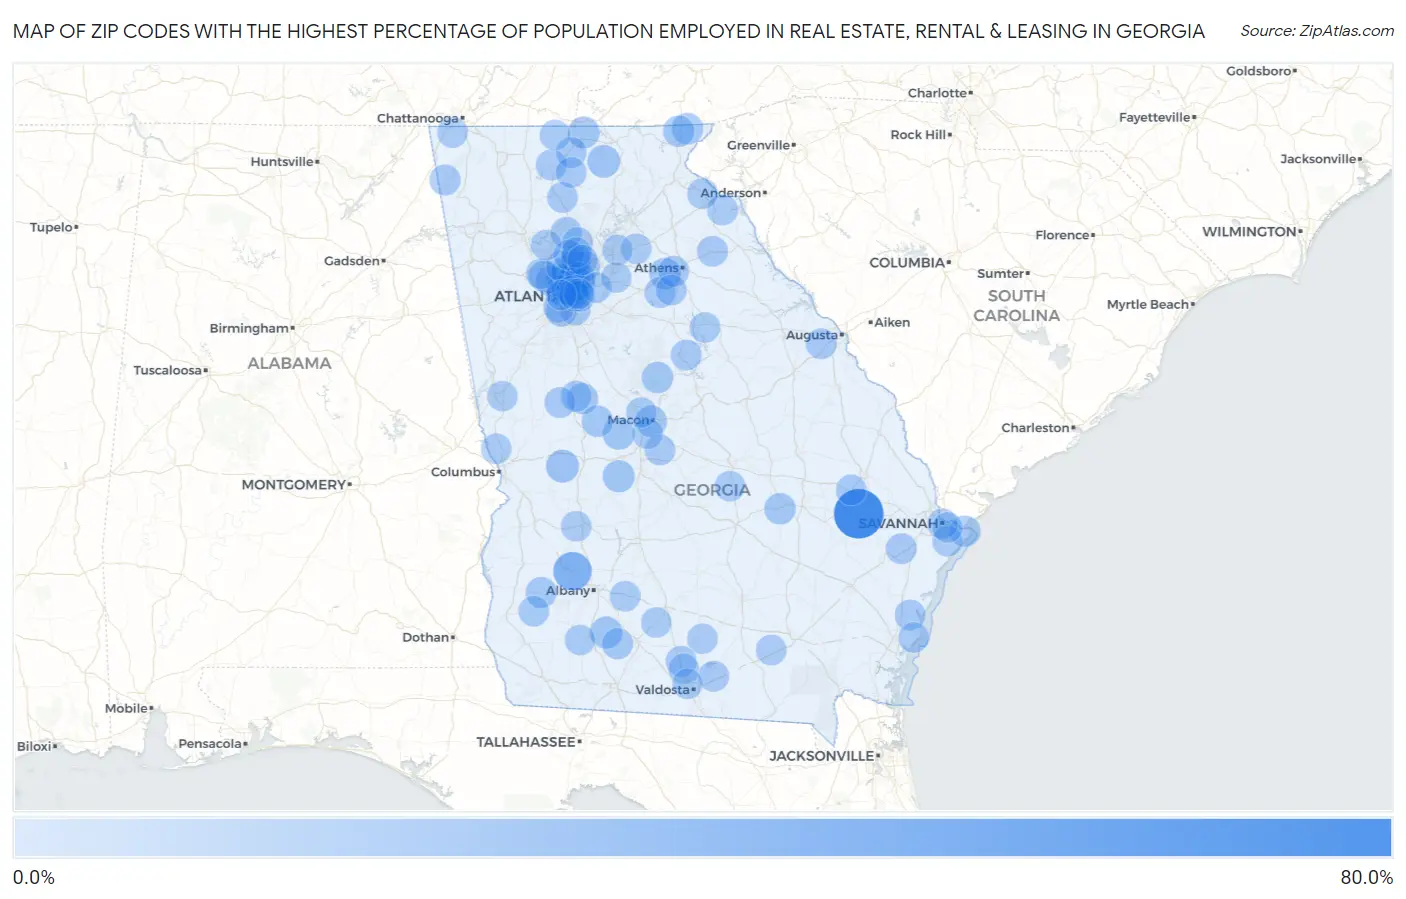
Map of Zip Codes with the Highest Percentage of Population Employed in Real Estate, Rental & Leasing in Georgia
0.0%
80.0%
Zip Codes with the Highest Percentage of Population Employed in Real Estate, Rental & Leasing in Georgia
| Zip Code | % Employed | vs State | vs National | |
| 1. | 30423 | 66.7% | 2.0%(+64.7)#1 | 1.9%(+64.8)#7 |
| 2. | 39885 | 28.6% | 2.0%(+26.6)#2 | 1.9%(+26.7)#49 |
| 3. | 31058 | 10.9% | 2.0%(+8.91)#3 | 1.9%(+8.98)#316 |
| 4. | 30572 | 10.2% | 2.0%(+8.28)#4 | 1.9%(+8.36)#363 |
| 5. | 31784 | 8.3% | 2.0%(+6.34)#5 | 1.9%(+6.41)#518 |
| 6. | 31057 | 8.1% | 2.0%(+6.14)#6 | 1.9%(+6.22)#542 |
| 7. | 31050 | 7.8% | 2.0%(+5.81)#7 | 1.9%(+5.88)#593 |
| 8. | 30559 | 7.6% | 2.0%(+5.58)#8 | 1.9%(+5.66)#626 |
| 9. | 30305 | 7.1% | 2.0%(+5.13)#9 | 1.9%(+5.21)#714 |
| 10. | 30537 | 6.5% | 2.0%(+4.58)#10 | 1.9%(+4.65)#811 |
| 11. | 31207 | 6.5% | 2.0%(+4.51)#11 | 1.9%(+4.58)#828 |
| 12. | 30622 | 6.4% | 2.0%(+4.48)#12 | 1.9%(+4.55)#839 |
| 13. | 31016 | 6.1% | 2.0%(+4.13)#13 | 1.9%(+4.20)#943 |
| 14. | 30410 | 6.1% | 2.0%(+4.11)#14 | 1.9%(+4.19)#949 |
| 15. | 31038 | 6.0% | 2.0%(+4.06)#15 | 1.9%(+4.13)#964 |
| 16. | 30327 | 6.0% | 2.0%(+4.04)#16 | 1.9%(+4.12)#968 |
| 17. | 30568 | 5.9% | 2.0%(+3.97)#17 | 1.9%(+4.04)#1,000 |
| 18. | 30324 | 5.8% | 2.0%(+3.80)#18 | 1.9%(+3.87)#1,049 |
| 19. | 31328 | 5.4% | 2.0%(+3.39)#19 | 1.9%(+3.47)#1,212 |
| 20. | 30285 | 5.2% | 2.0%(+3.27)#20 | 1.9%(+3.35)#1,273 |
| 21. | 31756 | 5.2% | 2.0%(+3.19)#21 | 1.9%(+3.27)#1,305 |
| 22. | 30342 | 5.1% | 2.0%(+3.16)#22 | 1.9%(+3.23)#1,320 |
| 23. | 30082 | 5.0% | 2.0%(+3.07)#23 | 1.9%(+3.14)#1,368 |
| 24. | 30337 | 5.0% | 2.0%(+3.03)#24 | 1.9%(+3.11)#1,380 |
| 25. | 30115 | 5.0% | 2.0%(+3.02)#25 | 1.9%(+3.09)#1,396 |
| 26. | 39866 | 4.8% | 2.0%(+2.85)#26 | 1.9%(+2.93)#1,492 |
| 27. | 30339 | 4.7% | 2.0%(+2.73)#27 | 1.9%(+2.81)#1,566 |
| 28. | 30326 | 4.6% | 2.0%(+2.68)#28 | 1.9%(+2.75)#1,610 |
| 29. | 30256 | 4.6% | 2.0%(+2.67)#29 | 1.9%(+2.74)#1,611 |
| 30. | 30731 | 4.6% | 2.0%(+2.66)#30 | 1.9%(+2.74)#1,621 |
| 31. | 31309 | 4.6% | 2.0%(+2.60)#31 | 1.9%(+2.67)#1,664 |
| 32. | 30629 | 4.5% | 2.0%(+2.57)#32 | 1.9%(+2.65)#1,687 |
| 33. | 30641 | 4.5% | 2.0%(+2.53)#33 | 1.9%(+2.61)#1,722 |
| 34. | 31305 | 4.3% | 2.0%(+2.35)#34 | 1.9%(+2.43)#1,856 |
| 35. | 31627 | 4.3% | 2.0%(+2.33)#35 | 1.9%(+2.41)#1,864 |
| 36. | 30258 | 4.2% | 2.0%(+2.23)#36 | 1.9%(+2.31)#1,954 |
| 37. | 30004 | 4.1% | 2.0%(+2.18)#37 | 1.9%(+2.25)#2,018 |
| 38. | 31024 | 4.1% | 2.0%(+2.16)#38 | 1.9%(+2.23)#2,042 |
| 39. | 30008 | 4.1% | 2.0%(+2.13)#39 | 1.9%(+2.21)#2,060 |
| 40. | 31641 | 4.1% | 2.0%(+2.12)#40 | 1.9%(+2.20)#2,074 |
| 41. | 30319 | 4.1% | 2.0%(+2.10)#41 | 1.9%(+2.18)#2,099 |
| 42. | 30540 | 4.0% | 2.0%(+2.02)#42 | 1.9%(+2.10)#2,184 |
| 43. | 30452 | 4.0% | 2.0%(+2.00)#43 | 1.9%(+2.08)#2,210 |
| 44. | 30606 | 3.9% | 2.0%(+1.97)#44 | 1.9%(+2.05)#2,244 |
| 45. | 30621 | 3.9% | 2.0%(+1.90)#45 | 1.9%(+1.98)#2,308 |
| 46. | 30905 | 3.8% | 2.0%(+1.85)#46 | 1.9%(+1.93)#2,369 |
| 47. | 30516 | 3.8% | 2.0%(+1.83)#47 | 1.9%(+1.90)#2,395 |
| 48. | 30329 | 3.7% | 2.0%(+1.76)#48 | 1.9%(+1.84)#2,474 |
| 49. | 30309 | 3.7% | 2.0%(+1.76)#49 | 1.9%(+1.84)#2,477 |
| 50. | 30318 | 3.7% | 2.0%(+1.74)#50 | 1.9%(+1.81)#2,510 |
| 51. | 30143 | 3.7% | 2.0%(+1.73)#51 | 1.9%(+1.80)#2,528 |
| 52. | 30513 | 3.7% | 2.0%(+1.69)#52 | 1.9%(+1.76)#2,582 |
| 53. | 30288 | 3.6% | 2.0%(+1.65)#53 | 1.9%(+1.72)#2,652 |
| 54. | 30350 | 3.6% | 2.0%(+1.60)#54 | 1.9%(+1.67)#2,726 |
| 55. | 39813 | 3.6% | 2.0%(+1.60)#55 | 1.9%(+1.67)#2,732 |
| 56. | 30344 | 3.6% | 2.0%(+1.59)#56 | 1.9%(+1.66)#2,751 |
| 57. | 30064 | 3.5% | 2.0%(+1.58)#57 | 1.9%(+1.65)#2,767 |
| 58. | 30345 | 3.5% | 2.0%(+1.55)#58 | 1.9%(+1.62)#2,810 |
| 59. | 30328 | 3.5% | 2.0%(+1.52)#59 | 1.9%(+1.60)#2,854 |
| 60. | 30536 | 3.5% | 2.0%(+1.52)#60 | 1.9%(+1.59)#2,873 |
| 61. | 31098 | 3.5% | 2.0%(+1.51)#61 | 1.9%(+1.58)#2,896 |
| 62. | 30092 | 3.5% | 2.0%(+1.50)#62 | 1.9%(+1.57)#2,907 |
| 63. | 30068 | 3.4% | 2.0%(+1.45)#63 | 1.9%(+1.52)#2,991 |
| 64. | 31550 | 3.4% | 2.0%(+1.43)#64 | 1.9%(+1.51)#3,025 |
| 65. | 30548 | 3.4% | 2.0%(+1.43)#65 | 1.9%(+1.50)#3,043 |
| 66. | 30076 | 3.4% | 2.0%(+1.40)#66 | 1.9%(+1.47)#3,094 |
| 67. | 31791 | 3.4% | 2.0%(+1.39)#67 | 1.9%(+1.46)#3,124 |
| 68. | 30317 | 3.3% | 2.0%(+1.38)#68 | 1.9%(+1.45)#3,136 |
| 69. | 31719 | 3.3% | 2.0%(+1.37)#69 | 1.9%(+1.44)#3,149 |
| 70. | 30075 | 3.3% | 2.0%(+1.32)#70 | 1.9%(+1.39)#3,248 |
| 71. | 30341 | 3.3% | 2.0%(+1.30)#71 | 1.9%(+1.38)#3,282 |
| 72. | 30306 | 3.3% | 2.0%(+1.29)#72 | 1.9%(+1.36)#3,319 |
| 73. | 31216 | 3.2% | 2.0%(+1.28)#73 | 1.9%(+1.36)#3,325 |
| 74. | 30032 | 3.2% | 2.0%(+1.28)#74 | 1.9%(+1.36)#3,330 |
| 75. | 30307 | 3.2% | 2.0%(+1.28)#75 | 1.9%(+1.35)#3,332 |
| 76. | 30541 | 3.2% | 2.0%(+1.24)#76 | 1.9%(+1.32)#3,396 |
| 77. | 30009 | 3.2% | 2.0%(+1.18)#77 | 1.9%(+1.26)#3,517 |
| 78. | 30557 | 3.1% | 2.0%(+1.17)#78 | 1.9%(+1.25)#3,539 |
| 79. | 30189 | 3.1% | 2.0%(+1.17)#79 | 1.9%(+1.24)#3,548 |
| 80. | 30750 | 3.1% | 2.0%(+1.17)#80 | 1.9%(+1.24)#3,554 |
| 81. | 30087 | 3.1% | 2.0%(+1.17)#81 | 1.9%(+1.24)#3,556 |
| 82. | 31210 | 3.1% | 2.0%(+1.11)#82 | 1.9%(+1.18)#3,697 |
| 83. | 31411 | 3.1% | 2.0%(+1.09)#83 | 1.9%(+1.16)#3,737 |
| 84. | 31808 | 3.1% | 2.0%(+1.08)#84 | 1.9%(+1.16)#3,753 |
| 85. | 30519 | 3.0% | 2.0%(+1.05)#85 | 1.9%(+1.13)#3,841 |
| 86. | 30030 | 3.0% | 2.0%(+1.04)#86 | 1.9%(+1.12)#3,882 |
| 87. | 31522 | 3.0% | 2.0%(+1.03)#87 | 1.9%(+1.10)#3,910 |
| 88. | 30642 | 3.0% | 2.0%(+1.01)#88 | 1.9%(+1.08)#3,965 |
| 89. | 30314 | 2.9% | 2.0%(+0.966)#89 | 1.9%(+1.04)#4,076 |
| 90. | 31632 | 2.9% | 2.0%(+0.964)#90 | 1.9%(+1.04)#4,081 |
| 91. | 31075 | 2.9% | 2.0%(+0.937)#91 | 1.9%(+1.01)#4,161 |
| 92. | 30241 | 2.9% | 2.0%(+0.934)#92 | 1.9%(+1.01)#4,168 |
| 93. | 31602 | 2.9% | 2.0%(+0.932)#93 | 1.9%(+1.01)#4,180 |
| 94. | 30022 | 2.9% | 2.0%(+0.931)#94 | 1.9%(+1.00)#4,184 |
| 95. | 31639 | 2.9% | 2.0%(+0.924)#95 | 1.9%(+0.999)#4,199 |
| 96. | 30017 | 2.9% | 2.0%(+0.921)#96 | 1.9%(+0.995)#4,207 |
| 97. | 31401 | 2.8% | 2.0%(+0.878)#97 | 1.9%(+0.952)#4,314 |
| 98. | 31404 | 2.8% | 2.0%(+0.856)#98 | 1.9%(+0.931)#4,372 |
| 99. | 31775 | 2.8% | 2.0%(+0.856)#99 | 1.9%(+0.931)#4,374 |
| 100. | 31730 | 2.8% | 2.0%(+0.855)#100 | 1.9%(+0.929)#4,377 |
Common Questions
What are the Top 10 Zip Codes with the Highest Percentage of Population Employed in Real Estate, Rental & Leasing in Georgia?
Top 10 Zip Codes with the Highest Percentage of Population Employed in Real Estate, Rental & Leasing in Georgia are:
What zip code has the Highest Percentage of Population Employed in Real Estate, Rental & Leasing in Georgia?
30423 has the Highest Percentage of Population Employed in Real Estate, Rental & Leasing in Georgia with 66.7%.
What is the Percentage of Population Employed in Real Estate, Rental & Leasing in the State of Georgia?
Percentage of Population Employed in Real Estate, Rental & Leasing in Georgia is 2.0%.
What is the Percentage of Population Employed in Real Estate, Rental & Leasing in the United States?
Percentage of Population Employed in Real Estate, Rental & Leasing in the United States is 1.9%.