Zip Codes with the Highest Percentage of Population Employed in Real Estate, Rental & Leasing in Rhode Island

RELATED REPORTS & OPTIONS

Real Estate, Rental & Leasing
Population
Families and Households
Female Fertility
Female Fertility (Unmarried)
Race (Community Size)
Race (Percentage)
Ancestry (Community Size)
AfghanAfricanAlaska NativeAlaskan AthabascanAlbanianAleutAlsatianAmericanApacheArabArapahoArgentineanArmenianAssyrian / Chaldean / SyriacAustralianAustrianBahamianBangladeshiBarbadianBasqueBelgianBelizeanBermudanBhutaneseBlackfeetBolivianBrazilianBritishBritish West IndianBulgarianBurmeseCajunCambodianCanadianCape VerdeanCarpatho RusynCelticCentral AmericanCentral American IndianCherokeeCheyenneChickasawChileanChineseChippewaChoctawColombianColvilleComancheCosta RicanCreeCreekCroatianCrowCubanCypriotCzechCzechoslovakianDanishDelawareDominicanDutchDutch West IndianEastern EuropeanEcuadorianEgyptianEnglishEstonianEthiopianEuropeanFijianFilipinoFinnishFrenchFrench American IndianFrench CanadianGermanGerman RussianGhanaianGreekGuamanian / ChamorroGuatemalanGuyaneseHaitianHmongHonduranHopiHoumaHungarianIcelanderIndian (Asian)IndonesianInupiatIranianIraqiIrishIroquoisIsraeliItalianJamaicanJapaneseJordanianKenyanKiowaKoreanLaotianLatvianLebaneseLiberianLithuanianLumbeeLuxembourgerMacedonianMalaysianMalteseMarshalleseMenomineeMexicanMexican American IndianMongolianMoroccanNative HawaiianNavajoNepaleseNew ZealanderNicaraguanNigerianNorthern EuropeanNorwegianOkinawanOsageOttawaPaiutePakistaniPalestinianPanamanianParaguayanPennsylvania GermanPeruvianPimaPolishPortuguesePotawatomiPuebloPuerto RicanPuget Sound SalishRomanianRussianSalvadoranSamoanScandinavianScotch-IrishScottishSeminoleSenegaleseSerbianShoshoneSierra LeoneanSiouxSlavicSlovakSloveneSomaliSouth AfricanSouth AmericanSouth American IndianSoviet UnionSpaniardSpanishSpanish AmericanSpanish American IndianSri LankanSubsaharan AfricanSudaneseSwedishSwissSyrianTaiwaneseThaiTlingit-HaidaTohono O'OdhamTonganTrinidadian and TobagonianTsimshianTurkishU.S. Virgin IslanderUgandanUkrainianUruguayanUteVenezuelanVietnameseWelshWest IndianYakamaYaquiYugoslavianYumanYup'ikZimbabwean
Ancestry (Percentage)
AfghanAfricanAlaska NativeAlaskan AthabascanAlbanianAleutAlsatianAmericanApacheArabArapahoArgentineanArmenianAssyrian / Chaldean / SyriacAustralianAustrianBahamianBangladeshiBarbadianBasqueBelgianBelizeanBermudanBhutaneseBlackfeetBolivianBrazilianBritishBritish West IndianBulgarianBurmeseCajunCambodianCanadianCape VerdeanCarpatho RusynCelticCentral AmericanCentral American IndianCherokeeCheyenneChickasawChileanChineseChippewaChoctawColombianColvilleComancheCosta RicanCreeCreekCroatianCrowCubanCypriotCzechCzechoslovakianDanishDelawareDominicanDutchDutch West IndianEastern EuropeanEcuadorianEgyptianEnglishEstonianEthiopianEuropeanFijianFilipinoFinnishFrenchFrench American IndianFrench CanadianGermanGerman RussianGhanaianGreekGuamanian / ChamorroGuatemalanGuyaneseHaitianHmongHonduranHopiHoumaHungarianIcelanderIndian (Asian)IndonesianInupiatIranianIraqiIrishIroquoisIsraeliItalianJamaicanJapaneseJordanianKenyanKiowaKoreanLaotianLatvianLebaneseLiberianLithuanianLumbeeLuxembourgerMacedonianMalaysianMalteseMarshalleseMenomineeMexicanMexican American IndianMongolianMoroccanNative HawaiianNavajoNepaleseNew ZealanderNicaraguanNigerianNorthern EuropeanNorwegianOkinawanOsageOttawaPaiutePakistaniPalestinianPanamanianParaguayanPennsylvania GermanPeruvianPimaPolishPortuguesePotawatomiPuebloPuerto RicanPuget Sound SalishRomanianRussianSalvadoranSamoanScandinavianScotch-IrishScottishSeminoleSenegaleseSerbianShoshoneSierra LeoneanSiouxSlavicSlovakSloveneSomaliSouth AfricanSouth AmericanSouth American IndianSoviet UnionSpaniardSpanishSpanish AmericanSpanish American IndianSri LankanSubsaharan AfricanSudaneseSwedishSwissSyrianTaiwaneseThaiTlingit-HaidaTohono O'OdhamTonganTrinidadian and TobagonianTsimshianTurkishU.S. Virgin IslanderUgandanUkrainianUruguayanUteVenezuelanVietnameseWelshWest IndianYakamaYaquiYugoslavianYumanYup'ikZimbabwean
Immigrant Origin (Total)
AfghanistanAfricaAlbaniaArgentinaArmeniaAsiaAustraliaAustriaAzoresBahamasBangladeshBarbadosBelarusBelgiumBelizeBoliviaBosnia and HerzegovinaBrazilBulgariaBurma / MyanmarCabo VerdeCambodiaCameroonCanadaCaribbeanCentral AmericaChileChinaColombiaCongoCosta RicaCroatiaCubaCzechoslovakiaDenmarkDominicaDominican RepublicEastern AfricaEastern AsiaEastern EuropeEcuadorEgyptEl SalvadorEnglandEritreaEthiopiaEuropeFijiFranceGermanyGhanaGreeceGrenadaGuatemalaGuyanaHaitiHondurasHong KongHungaryIndiaIndonesiaIranIraqIrelandIsraelItalyJamaicaJapanJordanKazakhstanKenyaKoreaKuwaitLaosLatin AmericaLatviaLebanonLiberiaLithuaniaMalaysiaMexicoMicronesiaMiddle AfricaMoldovaMoroccoNepalNetherlandsNicaraguaNigeriaNorth MacedoniaNorthern AfricaNorthern EuropeNorwayOceaniaPakistanPanamaPeruPhilippinesPolandPortugalRomaniaRussiaSaudi ArabiaScotlandSenegalSerbiaSierra LeoneSingaporeSomaliaSouth AfricaSouth AmericaSouth Central AsiaSouth Eastern AsiaSouthern EuropeSpainSri LankaSt. Vincent and the GrenadinesSudanSwedenSwitzerlandSyriaTaiwanThailandTrinidad and TobagoTurkeyUgandaUkraineUruguayUzbekistanVenezuelaVietnamWest IndiesWestern AfricaWestern AsiaWestern EuropeYemenZaireZimbabwe
Immigrant Origin (Percentage)
AfghanistanAfricaAlbaniaArgentinaArmeniaAsiaAustraliaAustriaAzoresBahamasBangladeshBarbadosBelarusBelgiumBelizeBoliviaBosnia and HerzegovinaBrazilBulgariaBurma / MyanmarCabo VerdeCambodiaCameroonCanadaCaribbeanCentral AmericaChileChinaColombiaCongoCosta RicaCroatiaCubaCzechoslovakiaDenmarkDominicaDominican RepublicEastern AfricaEastern AsiaEastern EuropeEcuadorEgyptEl SalvadorEnglandEritreaEthiopiaEuropeFijiFranceGermanyGhanaGreeceGrenadaGuatemalaGuyanaHaitiHondurasHong KongHungaryIndiaIndonesiaIranIraqIrelandIsraelItalyJamaicaJapanJordanKazakhstanKenyaKoreaKuwaitLaosLatin AmericaLatviaLebanonLiberiaLithuaniaMalaysiaMexicoMicronesiaMiddle AfricaMoldovaMoroccoNepalNetherlandsNicaraguaNigeriaNorth MacedoniaNorthern AfricaNorthern EuropeNorwayOceaniaPakistanPanamaPeruPhilippinesPolandPortugalRomaniaRussiaSaudi ArabiaScotlandSenegalSerbiaSierra LeoneSingaporeSomaliaSouth AfricaSouth AmericaSouth Central AsiaSouth Eastern AsiaSouthern EuropeSpainSri LankaSt. Vincent and the GrenadinesSudanSwedenSwitzerlandSyriaTaiwanThailandTrinidad and TobagoTurkeyUgandaUkraineUruguayUzbekistanVenezuelaVietnamWest IndiesWestern AfricaWestern AsiaWestern EuropeYemenZaireZimbabwe
Income
Income (Families)
Income (Households)
Poverty
Poverty (Families)
Unemployment
Employment Occupations
Employment Industries
Employer Class
Commute Time
Commute Means
School Enrollment
Education by Degree Field
Occupancy
Finances
Physical Characteristics
Rhode Island
Compare Zip Codes
Comparison Subject

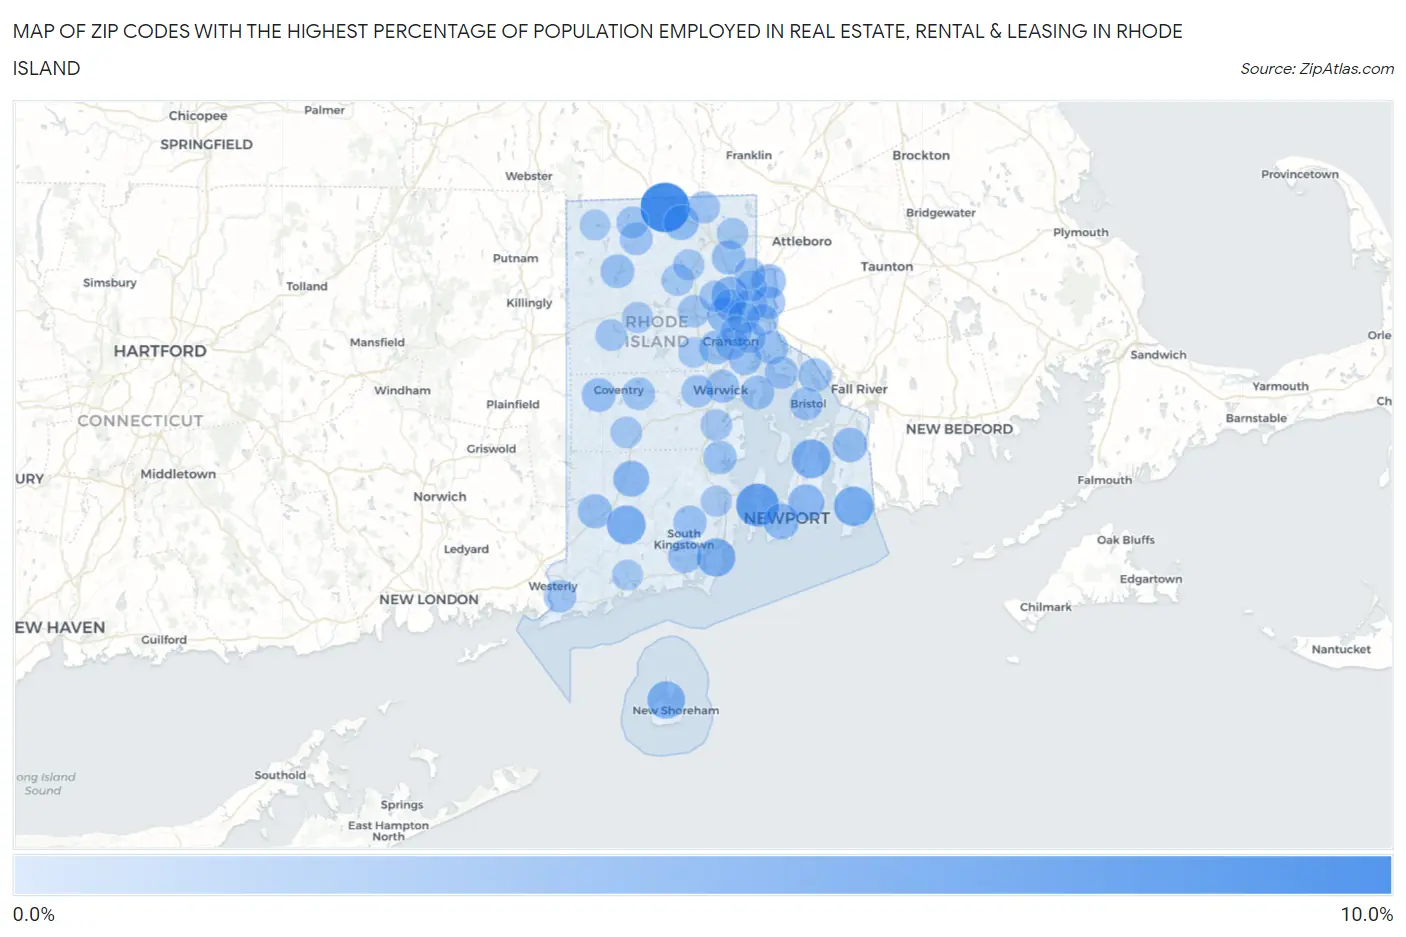
Map of Zip Codes with the Highest Percentage of Population Employed in Real Estate, Rental & Leasing in Rhode Island

0.0%
10.0%
Zip Codes with the Highest Percentage of Population Employed in Real Estate, Rental & Leasing in Rhode Island Map

Zip Codes with the Highest Percentage of Population Employed in Real Estate, Rental & Leasing in Rhode Island

Zip Code % Employed vs State vs National
1.028769.7%1.4%(+8.25)#11.9%(+7.79)#406
2.028356.3%1.4%(+4.84)#21.9%(+4.37)#888
3.028374.5%1.4%(+3.12)#31.9%(+2.65)#1,680
4.028714.2%1.4%(+2.82)#41.9%(+2.36)#1,920
5.028124.2%1.4%(+2.73)#51.9%(+2.27)#2,003
6.028824.1%1.4%(+2.63)#61.9%(+2.17)#2,109
7.028073.6%1.4%(+2.18)#71.9%(+1.71)#2,664
8.029043.1%1.4%(+1.70)#81.9%(+1.23)#3,581
9.028423.0%1.4%(+1.54)#91.9%(+1.07)#4,009
10.028222.8%1.4%(+1.41)#101.9%(+0.938)#4,357
11.029092.6%1.4%(+1.20)#111.9%(+0.730)#5,028
12.028402.6%1.4%(+1.20)#121.9%(+0.730)#5,029
13.028962.4%1.4%(+0.992)#131.9%(+0.524)#5,832
14.028782.1%1.4%(+0.688)#141.9%(+0.220)#7,258
15.028612.0%1.4%(+0.565)#151.9%(+0.097)#7,899
16.028321.9%1.4%(+0.455)#161.9%(-0.013)#8,609
17.029201.8%1.4%(+0.394)#171.9%(-0.074)#9,001
18.028651.8%1.4%(+0.394)#181.9%(-0.074)#9,003
19.028271.8%1.4%(+0.393)#191.9%(-0.075)#9,009
20.028791.8%1.4%(+0.358)#201.9%(-0.110)#9,249
21.028141.8%1.4%(+0.331)#211.9%(-0.137)#9,412
22.028891.6%1.4%(+0.214)#221.9%(-0.254)#10,192
23.028811.6%1.4%(+0.208)#231.9%(-0.260)#10,236
24.029151.6%1.4%(+0.193)#241.9%(-0.276)#10,337
25.028521.6%1.4%(+0.171)#251.9%(-0.297)#10,472
26.028851.5%1.4%(+0.060)#261.9%(-0.408)#11,279
27.028091.4%1.4%(-0.019)#271.9%(-0.487)#11,940
28.028861.4%1.4%(-0.021)#281.9%(-0.489)#11,951
29.028881.4%1.4%(-0.060)#291.9%(-0.528)#12,258
30.029161.4%1.4%(-0.066)#301.9%(-0.534)#12,282
31.028911.3%1.4%(-0.120)#311.9%(-0.588)#12,695
32.028391.3%1.4%(-0.124)#321.9%(-0.592)#12,713
33.028061.3%1.4%(-0.124)#331.9%(-0.592)#12,715
34.029061.3%1.4%(-0.143)#341.9%(-0.611)#12,870
35.029101.2%1.4%(-0.215)#351.9%(-0.683)#13,418
36.028161.1%1.4%(-0.288)#361.9%(-0.756)#13,990
37.028931.1%1.4%(-0.310)#371.9%(-0.778)#14,167
38.029191.1%1.4%(-0.337)#381.9%(-0.805)#14,405
39.028951.0%1.4%(-0.399)#391.9%(-0.867)#14,941
40.028301.0%1.4%(-0.399)#401.9%(-0.867)#14,942
41.028280.92%1.4%(-0.499)#411.9%(-0.967)#15,748
42.029080.92%1.4%(-0.502)#421.9%(-0.970)#15,784
43.029140.81%1.4%(-0.617)#431.9%(-1.08)#16,677
44.029030.77%1.4%(-0.655)#441.9%(-1.12)#16,933
45.028180.74%1.4%(-0.683)#451.9%(-1.15)#17,148
46.028250.72%1.4%(-0.704)#461.9%(-1.17)#17,329
47.028640.72%1.4%(-0.705)#471.9%(-1.17)#17,333
48.028170.70%1.4%(-0.725)#481.9%(-1.19)#17,515
49.028600.65%1.4%(-0.769)#491.9%(-1.24)#17,836
50.029170.61%1.4%(-0.817)#501.9%(-1.29)#18,215
51.029050.59%1.4%(-0.830)#511.9%(-1.30)#18,325
52.029110.58%1.4%(-0.847)#521.9%(-1.32)#18,461
53.028630.57%1.4%(-0.855)#531.9%(-1.32)#18,535
54.029070.53%1.4%(-0.895)#541.9%(-1.36)#18,847
55.028570.52%1.4%(-0.900)#551.9%(-1.37)#18,891
56.028740.46%1.4%(-0.964)#561.9%(-1.43)#19,373
57.028130.33%1.4%(-1.10)#571.9%(-1.57)#20,295
58.029210.28%1.4%(-1.14)#581.9%(-1.61)#20,587
59.028590.28%1.4%(-1.15)#591.9%(-1.61)#20,594

Common Questions

What are the Top 10 Zip Codes with the Highest Percentage of Population Employed in Real Estate, Rental & Leasing in Rhode Island?
Top 10 Zip Codes with the Highest Percentage of Population Employed in Real Estate, Rental & Leasing in Rhode Island are:
#1
9.7%
#2
6.3%
#3
4.5%
#4
4.2%
#5
4.2%
#6
4.1%
#7
3.6%
#8
3.1%
#9
3.0%
#10
2.8%
What zip code has the Highest Percentage of Population Employed in Real Estate, Rental & Leasing in Rhode Island?
02876 has the Highest Percentage of Population Employed in Real Estate, Rental & Leasing in Rhode Island with 9.7%.
What is the Percentage of Population Employed in Real Estate, Rental & Leasing in the State of Rhode Island?
Percentage of Population Employed in Real Estate, Rental & Leasing in Rhode Island is 1.4%.
What is the Percentage of Population Employed in Real Estate, Rental & Leasing in the United States?
Percentage of Population Employed in Real Estate, Rental & Leasing in the United States is 1.9%.