Zip Codes with the Highest Percentage of Population Employed in Real Estate, Rental & Leasing in Idaho
RELATED REPORTS & OPTIONS
Real Estate, Rental & Leasing
Idaho
Compare Zip Codes
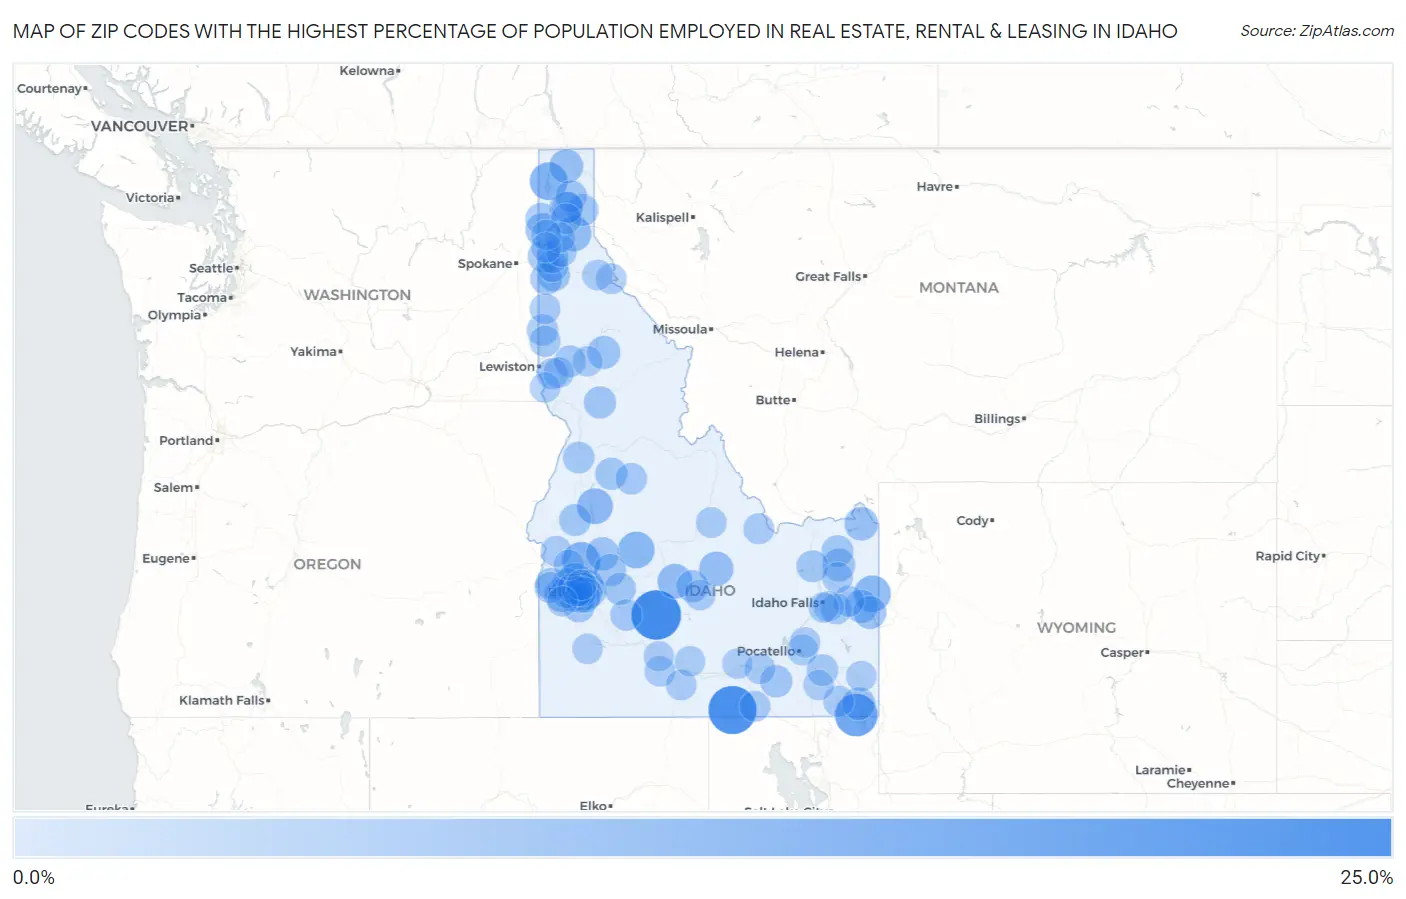
Map of Zip Codes with the Highest Percentage of Population Employed in Real Estate, Rental & Leasing in Idaho
0.0%
25.0%
Zip Codes with the Highest Percentage of Population Employed in Real Estate, Rental & Leasing in Idaho
| Zip Code | % Employed | vs State | vs National | |
| 1. | 83322 | 24.1% | 2.0%(+22.1)#1 | 1.9%(+22.2)#75 |
| 2. | 83312 | 22.4% | 2.0%(+20.4)#2 | 1.9%(+20.5)#89 |
| 3. | 83287 | 15.8% | 2.0%(+13.8)#3 | 1.9%(+13.9)#153 |
| 4. | 83670 | 10.5% | 2.0%(+8.44)#4 | 1.9%(+8.56)#348 |
| 5. | 83821 | 10.1% | 2.0%(+8.08)#5 | 1.9%(+8.20)#377 |
| 6. | 83455 | 8.7% | 2.0%(+6.64)#6 | 1.9%(+6.76)#485 |
| 7. | 83637 | 8.6% | 2.0%(+6.61)#7 | 1.9%(+6.73)#487 |
| 8. | 83615 | 7.7% | 2.0%(+5.68)#8 | 1.9%(+5.80)#608 |
| 9. | 83803 | 7.1% | 2.0%(+5.08)#9 | 1.9%(+5.20)#717 |
| 10. | 83340 | 6.5% | 2.0%(+4.49)#10 | 1.9%(+4.61)#822 |
| 11. | 83251 | 6.0% | 2.0%(+3.99)#11 | 1.9%(+4.11)#976 |
| 12. | 83805 | 5.7% | 2.0%(+3.67)#12 | 1.9%(+3.79)#1,084 |
| 13. | 83616 | 5.6% | 2.0%(+3.61)#13 | 1.9%(+3.73)#1,109 |
| 14. | 83804 | 5.5% | 2.0%(+3.46)#14 | 1.9%(+3.58)#1,161 |
| 15. | 83429 | 5.1% | 2.0%(+3.09)#15 | 1.9%(+3.21)#1,334 |
| 16. | 83651 | 4.9% | 2.0%(+2.93)#16 | 1.9%(+3.05)#1,428 |
| 17. | 83852 | 4.7% | 2.0%(+2.72)#17 | 1.9%(+2.84)#1,540 |
| 18. | 83449 | 4.7% | 2.0%(+2.70)#18 | 1.9%(+2.83)#1,549 |
| 19. | 83622 | 4.7% | 2.0%(+2.67)#19 | 1.9%(+2.79)#1,574 |
| 20. | 83546 | 4.6% | 2.0%(+2.62)#20 | 1.9%(+2.74)#1,612 |
| 21. | 83702 | 4.5% | 2.0%(+2.44)#21 | 1.9%(+2.56)#1,751 |
| 22. | 83223 | 4.4% | 2.0%(+2.43)#22 | 1.9%(+2.55)#1,761 |
| 23. | 83428 | 4.4% | 2.0%(+2.40)#23 | 1.9%(+2.52)#1,781 |
| 24. | 83438 | 4.3% | 2.0%(+2.27)#24 | 1.9%(+2.39)#1,875 |
| 25. | 83833 | 4.1% | 2.0%(+2.05)#25 | 1.9%(+2.17)#2,100 |
| 26. | 83353 | 3.8% | 2.0%(+1.83)#26 | 1.9%(+1.95)#2,329 |
| 27. | 83712 | 3.8% | 2.0%(+1.83)#27 | 1.9%(+1.95)#2,344 |
| 28. | 83631 | 3.7% | 2.0%(+1.71)#28 | 1.9%(+1.83)#2,483 |
| 29. | 83271 | 3.6% | 2.0%(+1.62)#29 | 1.9%(+1.74)#2,606 |
| 30. | 83552 | 3.6% | 2.0%(+1.56)#30 | 1.9%(+1.68)#2,710 |
| 31. | 83703 | 3.5% | 2.0%(+1.45)#31 | 1.9%(+1.57)#2,908 |
| 32. | 83706 | 3.5% | 2.0%(+1.44)#32 | 1.9%(+1.56)#2,925 |
| 33. | 83634 | 3.4% | 2.0%(+1.41)#33 | 1.9%(+1.53)#2,980 |
| 34. | 83836 | 3.4% | 2.0%(+1.37)#34 | 1.9%(+1.49)#3,051 |
| 35. | 83854 | 3.4% | 2.0%(+1.37)#35 | 1.9%(+1.49)#3,067 |
| 36. | 83638 | 3.4% | 2.0%(+1.37)#36 | 1.9%(+1.49)#3,068 |
| 37. | 83716 | 3.3% | 2.0%(+1.25)#37 | 1.9%(+1.37)#3,295 |
| 38. | 83445 | 3.2% | 2.0%(+1.22)#38 | 1.9%(+1.35)#3,342 |
| 39. | 83632 | 3.1% | 2.0%(+1.14)#39 | 1.9%(+1.26)#3,520 |
| 40. | 83876 | 3.1% | 2.0%(+1.12)#40 | 1.9%(+1.24)#3,551 |
| 41. | 83864 | 3.1% | 2.0%(+1.07)#41 | 1.9%(+1.19)#3,661 |
| 42. | 83425 | 3.0% | 2.0%(+1.000)#42 | 1.9%(+1.12)#3,871 |
| 43. | 83822 | 3.0% | 2.0%(+0.947)#43 | 1.9%(+1.07)#4,011 |
| 44. | 83814 | 2.9% | 2.0%(+0.922)#44 | 1.9%(+1.04)#4,071 |
| 45. | 83547 | 2.9% | 2.0%(+0.845)#45 | 1.9%(+0.965)#4,282 |
| 46. | 83647 | 2.8% | 2.0%(+0.775)#46 | 1.9%(+0.895)#4,463 |
| 47. | 83541 | 2.8% | 2.0%(+0.759)#47 | 1.9%(+0.880)#4,517 |
| 48. | 83656 | 2.8% | 2.0%(+0.748)#48 | 1.9%(+0.869)#4,541 |
| 49. | 83815 | 2.7% | 2.0%(+0.692)#49 | 1.9%(+0.813)#4,730 |
| 50. | 83872 | 2.7% | 2.0%(+0.640)#50 | 1.9%(+0.761)#4,926 |
| 51. | 83246 | 2.6% | 2.0%(+0.624)#51 | 1.9%(+0.744)#4,980 |
| 52. | 83611 | 2.6% | 2.0%(+0.591)#52 | 1.9%(+0.711)#5,094 |
| 53. | 83642 | 2.6% | 2.0%(+0.547)#53 | 1.9%(+0.667)#5,255 |
| 54. | 83835 | 2.5% | 2.0%(+0.452)#54 | 1.9%(+0.573)#5,616 |
| 55. | 83427 | 2.3% | 2.0%(+0.335)#55 | 1.9%(+0.456)#6,109 |
| 56. | 83540 | 2.3% | 2.0%(+0.242)#56 | 1.9%(+0.362)#6,547 |
| 57. | 83843 | 2.2% | 2.0%(+0.202)#57 | 1.9%(+0.323)#6,738 |
| 58. | 83840 | 2.2% | 2.0%(+0.179)#58 | 1.9%(+0.300)#6,851 |
| 59. | 83443 | 2.2% | 2.0%(+0.173)#59 | 1.9%(+0.294)#6,876 |
| 60. | 83669 | 2.2% | 2.0%(+0.142)#60 | 1.9%(+0.262)#7,048 |
| 61. | 83709 | 2.1% | 2.0%(+0.109)#61 | 1.9%(+0.230)#7,202 |
| 62. | 83687 | 2.1% | 2.0%(+0.105)#62 | 1.9%(+0.225)#7,226 |
| 63. | 83263 | 2.1% | 2.0%(+0.055)#63 | 1.9%(+0.176)#7,488 |
| 64. | 83464 | 2.0% | 2.0%(+0.015)#64 | 1.9%(+0.135)#7,704 |
| 65. | 83342 | 2.0% | 2.0%(-0.009)#65 | 1.9%(+0.112)#7,813 |
| 66. | 83201 | 2.0% | 2.0%(-0.034)#66 | 1.9%(+0.086)#7,966 |
| 67. | 83626 | 2.0% | 2.0%(-0.035)#67 | 1.9%(+0.085)#7,973 |
| 68. | 83440 | 2.0% | 2.0%(-0.060)#68 | 1.9%(+0.061)#8,111 |
| 69. | 83316 | 1.9% | 2.0%(-0.070)#69 | 1.9%(+0.050)#8,170 |
| 70. | 83661 | 1.9% | 2.0%(-0.085)#70 | 1.9%(+0.035)#8,270 |
| 71. | 83846 | 1.9% | 2.0%(-0.154)#71 | 1.9%(-0.033)#8,721 |
| 72. | 83524 | 1.8% | 2.0%(-0.170)#72 | 1.9%(-0.050)#8,846 |
| 73. | 83849 | 1.8% | 2.0%(-0.209)#73 | 1.9%(-0.088)#9,105 |
| 74. | 83211 | 1.8% | 2.0%(-0.250)#74 | 1.9%(-0.130)#9,365 |
| 75. | 83860 | 1.8% | 2.0%(-0.260)#75 | 1.9%(-0.140)#9,428 |
| 76. | 83646 | 1.8% | 2.0%(-0.261)#76 | 1.9%(-0.141)#9,432 |
| 77. | 83226 | 1.7% | 2.0%(-0.310)#77 | 1.9%(-0.190)#9,736 |
| 78. | 83824 | 1.7% | 2.0%(-0.317)#78 | 1.9%(-0.197)#9,790 |
| 79. | 83406 | 1.7% | 2.0%(-0.339)#79 | 1.9%(-0.218)#9,948 |
| 80. | 83301 | 1.6% | 2.0%(-0.362)#80 | 1.9%(-0.242)#10,122 |
| 81. | 83333 | 1.6% | 2.0%(-0.377)#81 | 1.9%(-0.257)#10,213 |
| 82. | 83705 | 1.6% | 2.0%(-0.380)#82 | 1.9%(-0.259)#10,226 |
| 83. | 83801 | 1.6% | 2.0%(-0.385)#83 | 1.9%(-0.264)#10,259 |
| 84. | 83869 | 1.6% | 2.0%(-0.386)#84 | 1.9%(-0.265)#10,262 |
| 85. | 83239 | 1.6% | 2.0%(-0.386)#85 | 1.9%(-0.266)#10,268 |
| 86. | 83202 | 1.6% | 2.0%(-0.436)#86 | 1.9%(-0.315)#10,594 |
| 87. | 83704 | 1.6% | 2.0%(-0.449)#87 | 1.9%(-0.329)#10,693 |
| 88. | 83624 | 1.5% | 2.0%(-0.472)#88 | 1.9%(-0.351)#10,851 |
| 89. | 83234 | 1.5% | 2.0%(-0.490)#89 | 1.9%(-0.370)#10,989 |
| 90. | 83350 | 1.5% | 2.0%(-0.502)#90 | 1.9%(-0.381)#11,074 |
| 91. | 83544 | 1.5% | 2.0%(-0.514)#91 | 1.9%(-0.393)#11,165 |
| 92. | 83713 | 1.5% | 2.0%(-0.515)#92 | 1.9%(-0.395)#11,178 |
| 93. | 83617 | 1.5% | 2.0%(-0.543)#93 | 1.9%(-0.423)#11,405 |
| 94. | 83714 | 1.5% | 2.0%(-0.543)#94 | 1.9%(-0.423)#11,406 |
| 95. | 83686 | 1.5% | 2.0%(-0.552)#95 | 1.9%(-0.431)#11,480 |
| 96. | 83501 | 1.4% | 2.0%(-0.567)#96 | 1.9%(-0.446)#11,613 |
| 97. | 83338 | 1.4% | 2.0%(-0.574)#97 | 1.9%(-0.453)#11,672 |
| 98. | 83404 | 1.4% | 2.0%(-0.588)#98 | 1.9%(-0.468)#11,793 |
| 99. | 83858 | 1.4% | 2.0%(-0.594)#99 | 1.9%(-0.473)#11,829 |
| 100. | 83332 | 1.4% | 2.0%(-0.607)#100 | 1.9%(-0.486)#11,933 |
Common Questions
What are the Top 10 Zip Codes with the Highest Percentage of Population Employed in Real Estate, Rental & Leasing in Idaho?
Top 10 Zip Codes with the Highest Percentage of Population Employed in Real Estate, Rental & Leasing in Idaho are:
What zip code has the Highest Percentage of Population Employed in Real Estate, Rental & Leasing in Idaho?
83322 has the Highest Percentage of Population Employed in Real Estate, Rental & Leasing in Idaho with 24.1%.
What is the Percentage of Population Employed in Real Estate, Rental & Leasing in the State of Idaho?
Percentage of Population Employed in Real Estate, Rental & Leasing in Idaho is 2.0%.
What is the Percentage of Population Employed in Real Estate, Rental & Leasing in the United States?
Percentage of Population Employed in Real Estate, Rental & Leasing in the United States is 1.9%.