Yuman vs Hispanic or Latino 2 or more Vehicles in Household
COMPARE
Yuman
Hispanic or Latino
2 or more Vehicles in Household
2 or more Vehicles in Household Comparison
Yuman
Hispanics or Latinos
51.7%
2 OR MORE VEHICLES IN HOUSEHOLD
0.1/ 100
METRIC RATING
278th/ 347
METRIC RANK
57.9%
2 OR MORE VEHICLES IN HOUSEHOLD
99.0/ 100
METRIC RATING
90th/ 347
METRIC RANK
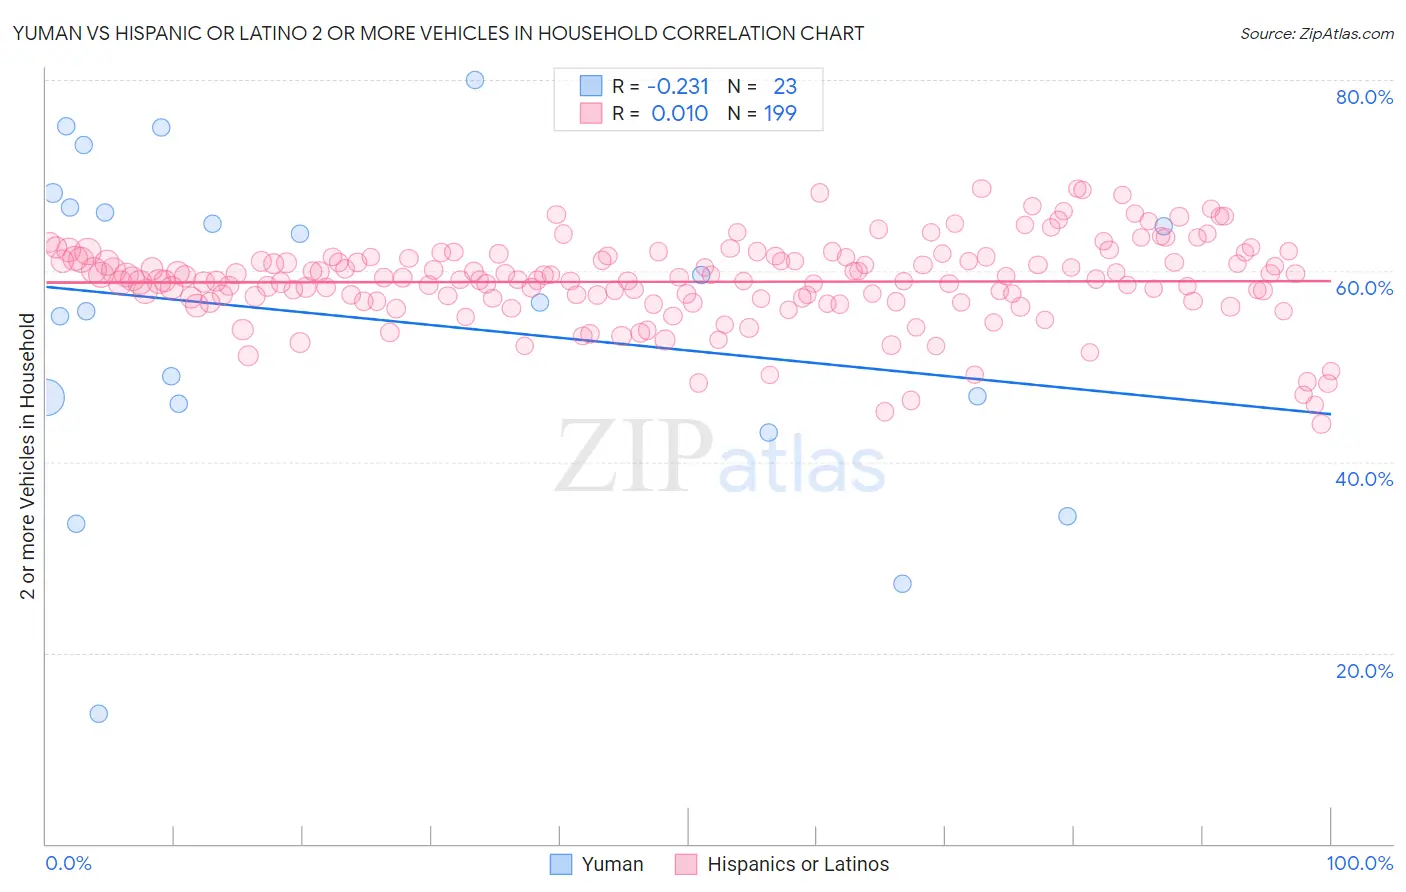
Yuman vs Hispanic or Latino 2 or more Vehicles in Household Correlation Chart
The statistical analysis conducted on geographies consisting of 40,663,643 people shows a weak negative correlation between the proportion of Yuman and percentage of households with 2 or more vehicles available in the United States with a correlation coefficient (R) of -0.231 and weighted average of 51.7%. Similarly, the statistical analysis conducted on geographies consisting of 560,775,190 people shows no correlation between the proportion of Hispanics or Latinos and percentage of households with 2 or more vehicles available in the United States with a correlation coefficient (R) of 0.010 and weighted average of 57.9%, a difference of 11.9%.
2 or more Vehicles in Household Correlation Summary
| Measurement | Yuman | Hispanic or Latino |
| Minimum | 13.6% | 44.0% |
| Maximum | 80.0% | 68.6% |
| Range | 66.4% | 24.6% |
| Mean | 55.0% | 58.9% |
| Median | 56.8% | 59.1% |
| Interquartile 25% (IQ1) | 46.1% | 56.9% |
| Interquartile 75% (IQ3) | 66.6% | 61.4% |
| Interquartile Range (IQR) | 20.5% | 4.5% |
| Standard Deviation (Sample) | 16.9% | 4.5% |
| Standard Deviation (Population) | 16.5% | 4.5% |
Similar Demographics by 2 or more Vehicles in Household
Demographics Similar to Yuman by 2 or more Vehicles in Household
In terms of 2 or more vehicles in household, the demographic groups most similar to Yuman are Liberian (51.7%, a difference of 0.010%), Immigrants from Eastern Europe (51.7%, a difference of 0.040%), Immigrants from Africa (51.8%, a difference of 0.060%), Immigrants from Croatia (51.8%, a difference of 0.12%), and Immigrants from Honduras (51.8%, a difference of 0.14%).
| Demographics | Rating | Rank | 2 or more Vehicles in Household |
| South Americans | 0.2 /100 | #271 | Tragic 51.9% |
| Sub-Saharan Africans | 0.2 /100 | #272 | Tragic 51.9% |
| Israelis | 0.2 /100 | #273 | Tragic 51.9% |
| Africans | 0.2 /100 | #274 | Tragic 51.8% |
| Immigrants | Honduras | 0.2 /100 | #275 | Tragic 51.8% |
| Immigrants | Croatia | 0.2 /100 | #276 | Tragic 51.8% |
| Immigrants | Africa | 0.2 /100 | #277 | Tragic 51.8% |
| Yuman | 0.1 /100 | #278 | Tragic 51.7% |
| Liberians | 0.1 /100 | #279 | Tragic 51.7% |
| Immigrants | Eastern Europe | 0.1 /100 | #280 | Tragic 51.7% |
| Immigrants | Kazakhstan | 0.1 /100 | #281 | Tragic 51.6% |
| Bahamians | 0.1 /100 | #282 | Tragic 51.5% |
| Immigrants | China | 0.1 /100 | #283 | Tragic 51.5% |
| Immigrants | Zaire | 0.1 /100 | #284 | Tragic 51.5% |
| Immigrants | Uruguay | 0.1 /100 | #285 | Tragic 51.4% |
Demographics Similar to Hispanics or Latinos by 2 or more Vehicles in Household
In terms of 2 or more vehicles in household, the demographic groups most similar to Hispanics or Latinos are Immigrants from Germany (57.9%, a difference of 0.0%), Pakistani (57.9%, a difference of 0.030%), Shoshone (57.9%, a difference of 0.050%), Ottawa (57.9%, a difference of 0.060%), and Immigrants from Iran (57.9%, a difference of 0.070%).
| Demographics | Rating | Rank | 2 or more Vehicles in Household |
| Icelanders | 99.2 /100 | #83 | Exceptional 58.0% |
| Maltese | 99.2 /100 | #84 | Exceptional 58.0% |
| Slovaks | 99.2 /100 | #85 | Exceptional 58.0% |
| Potawatomi | 99.1 /100 | #86 | Exceptional 58.0% |
| Thais | 99.1 /100 | #87 | Exceptional 57.9% |
| Immigrants | Iran | 99.1 /100 | #88 | Exceptional 57.9% |
| Immigrants | Germany | 99.0 /100 | #89 | Exceptional 57.9% |
| Hispanics or Latinos | 99.0 /100 | #90 | Exceptional 57.9% |
| Pakistanis | 99.0 /100 | #91 | Exceptional 57.9% |
| Shoshone | 99.0 /100 | #92 | Exceptional 57.9% |
| Ottawa | 99.0 /100 | #93 | Exceptional 57.9% |
| Filipinos | 98.9 /100 | #94 | Exceptional 57.8% |
| Hmong | 98.9 /100 | #95 | Exceptional 57.8% |
| Burmese | 98.8 /100 | #96 | Exceptional 57.8% |
| Slavs | 98.8 /100 | #97 | Exceptional 57.8% |