Yuman vs Immigrants from Somalia 2 or more Vehicles in Household
COMPARE
Yuman
Immigrants from Somalia
2 or more Vehicles in Household
2 or more Vehicles in Household Comparison
Yuman
Immigrants from Somalia
51.7%
2 OR MORE VEHICLES IN HOUSEHOLD
0.1/ 100
METRIC RATING
278th/ 347
METRIC RANK
50.5%
2 OR MORE VEHICLES IN HOUSEHOLD
0.0/ 100
METRIC RATING
296th/ 347
METRIC RANK
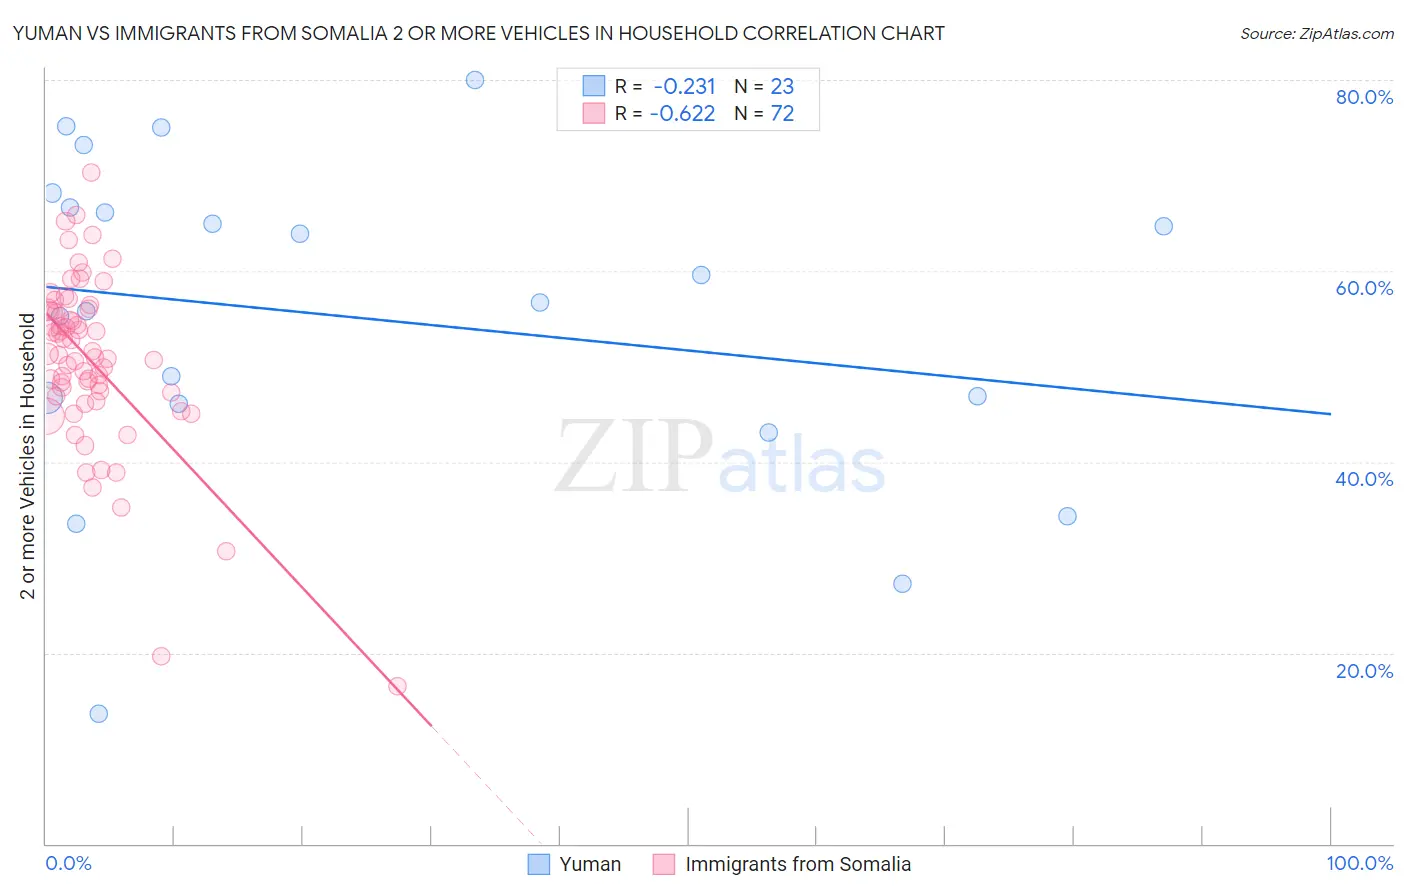
Yuman vs Immigrants from Somalia 2 or more Vehicles in Household Correlation Chart
The statistical analysis conducted on geographies consisting of 40,663,643 people shows a weak negative correlation between the proportion of Yuman and percentage of households with 2 or more vehicles available in the United States with a correlation coefficient (R) of -0.231 and weighted average of 51.7%. Similarly, the statistical analysis conducted on geographies consisting of 92,099,501 people shows a significant negative correlation between the proportion of Immigrants from Somalia and percentage of households with 2 or more vehicles available in the United States with a correlation coefficient (R) of -0.622 and weighted average of 50.5%, a difference of 2.4%.
2 or more Vehicles in Household Correlation Summary
| Measurement | Yuman | Immigrants from Somalia |
| Minimum | 13.6% | 16.4% |
| Maximum | 80.0% | 70.3% |
| Range | 66.4% | 53.8% |
| Mean | 55.0% | 50.6% |
| Median | 56.8% | 51.2% |
| Interquartile 25% (IQ1) | 46.1% | 47.1% |
| Interquartile 75% (IQ3) | 66.6% | 55.9% |
| Interquartile Range (IQR) | 20.5% | 8.8% |
| Standard Deviation (Sample) | 16.9% | 9.2% |
| Standard Deviation (Population) | 16.5% | 9.1% |
Demographics Similar to Yuman and Immigrants from Somalia by 2 or more Vehicles in Household
In terms of 2 or more vehicles in household, the demographic groups most similar to Yuman are Liberian (51.7%, a difference of 0.010%), Immigrants from Eastern Europe (51.7%, a difference of 0.040%), Immigrants from Africa (51.8%, a difference of 0.060%), Immigrants from Kazakhstan (51.6%, a difference of 0.36%), and Bahamian (51.5%, a difference of 0.41%). Similarly, the demographic groups most similar to Immigrants from Somalia are Cypriot (50.6%, a difference of 0.040%), Bermudan (50.6%, a difference of 0.11%), Immigrants from Spain (50.4%, a difference of 0.27%), Immigrants from Ukraine (50.9%, a difference of 0.67%), and Black/African American (50.9%, a difference of 0.67%).
| Demographics | Rating | Rank | 2 or more Vehicles in Household |
| Immigrants | Africa | 0.2 /100 | #277 | Tragic 51.8% |
| Yuman | 0.1 /100 | #278 | Tragic 51.7% |
| Liberians | 0.1 /100 | #279 | Tragic 51.7% |
| Immigrants | Eastern Europe | 0.1 /100 | #280 | Tragic 51.7% |
| Immigrants | Kazakhstan | 0.1 /100 | #281 | Tragic 51.6% |
| Bahamians | 0.1 /100 | #282 | Tragic 51.5% |
| Immigrants | China | 0.1 /100 | #283 | Tragic 51.5% |
| Immigrants | Zaire | 0.1 /100 | #284 | Tragic 51.5% |
| Immigrants | Uruguay | 0.1 /100 | #285 | Tragic 51.4% |
| Immigrants | Liberia | 0.1 /100 | #286 | Tragic 51.3% |
| Immigrants | Serbia | 0.1 /100 | #287 | Tragic 51.3% |
| Okinawans | 0.1 /100 | #288 | Tragic 51.2% |
| Somalis | 0.0 /100 | #289 | Tragic 51.1% |
| Immigrants | Panama | 0.0 /100 | #290 | Tragic 51.1% |
| Belizeans | 0.0 /100 | #291 | Tragic 51.0% |
| Immigrants | Ukraine | 0.0 /100 | #292 | Tragic 50.9% |
| Blacks/African Americans | 0.0 /100 | #293 | Tragic 50.9% |
| Bermudans | 0.0 /100 | #294 | Tragic 50.6% |
| Cypriots | 0.0 /100 | #295 | Tragic 50.6% |
| Immigrants | Somalia | 0.0 /100 | #296 | Tragic 50.5% |
| Immigrants | Spain | 0.0 /100 | #297 | Tragic 50.4% |