Somali vs Immigrants from Sierra Leone 2 or more Vehicles in Household
COMPARE
Somali
Immigrants from Sierra Leone
2 or more Vehicles in Household
2 or more Vehicles in Household Comparison
Somalis
Immigrants from Sierra Leone
51.1%
2 OR MORE VEHICLES IN HOUSEHOLD
0.0/ 100
METRIC RATING
289th/ 347
METRIC RANK
53.2%
2 OR MORE VEHICLES IN HOUSEHOLD
2.1/ 100
METRIC RATING
241st/ 347
METRIC RANK
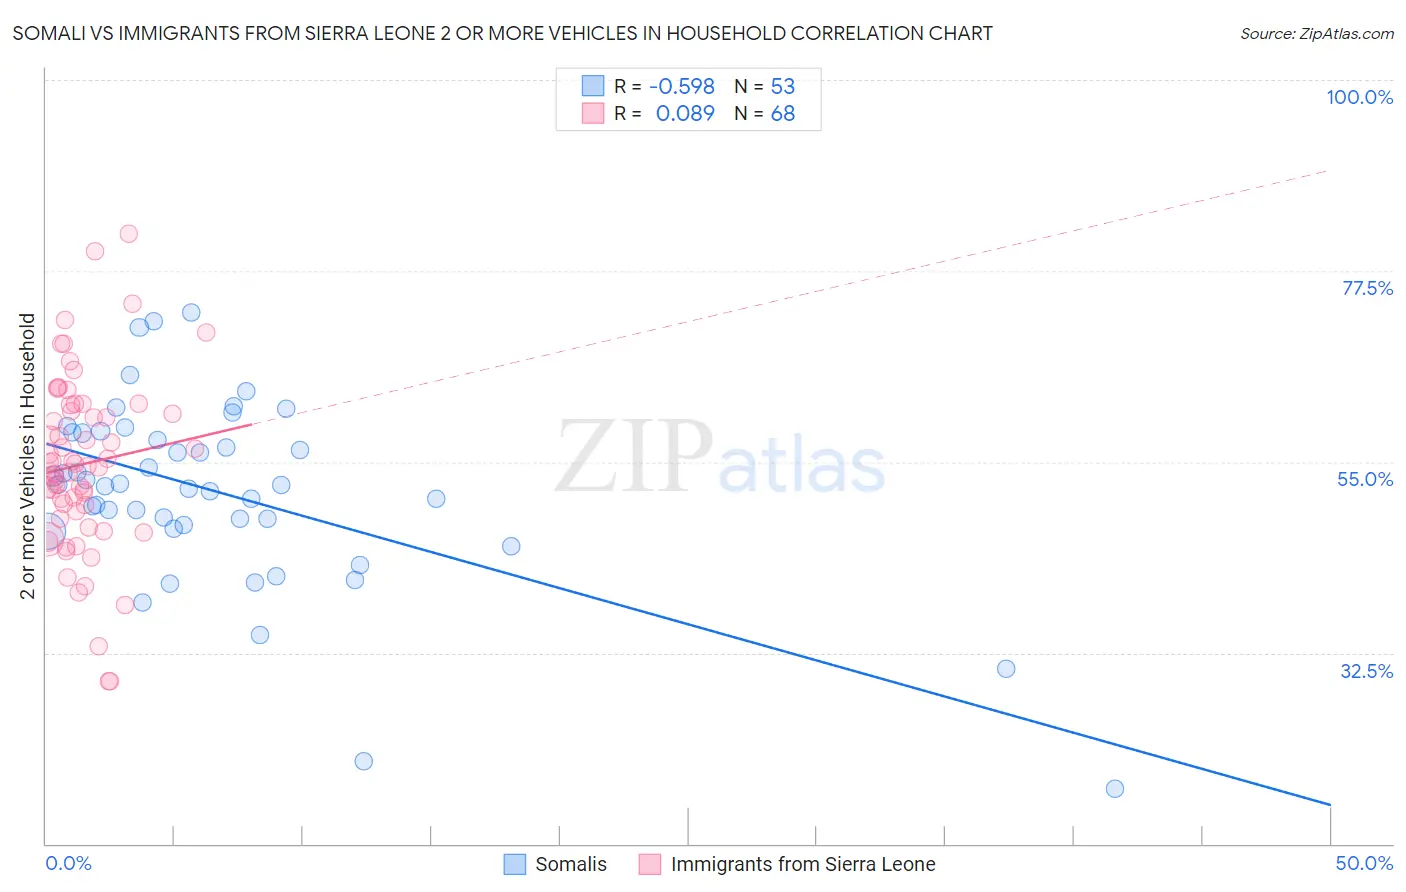
Somali vs Immigrants from Sierra Leone 2 or more Vehicles in Household Correlation Chart
The statistical analysis conducted on geographies consisting of 99,288,956 people shows a substantial negative correlation between the proportion of Somalis and percentage of households with 2 or more vehicles available in the United States with a correlation coefficient (R) of -0.598 and weighted average of 51.1%. Similarly, the statistical analysis conducted on geographies consisting of 101,647,201 people shows a slight positive correlation between the proportion of Immigrants from Sierra Leone and percentage of households with 2 or more vehicles available in the United States with a correlation coefficient (R) of 0.089 and weighted average of 53.2%, a difference of 4.2%.
2 or more Vehicles in Household Correlation Summary
| Measurement | Somali | Immigrants from Sierra Leone |
| Minimum | 16.4% | 29.1% |
| Maximum | 72.6% | 81.9% |
| Range | 56.2% | 52.8% |
| Mean | 51.4% | 54.7% |
| Median | 52.2% | 54.6% |
| Interquartile 25% (IQ1) | 47.3% | 48.7% |
| Interquartile 75% (IQ3) | 58.4% | 61.3% |
| Interquartile Range (IQR) | 11.1% | 12.6% |
| Standard Deviation (Sample) | 10.9% | 10.4% |
| Standard Deviation (Population) | 10.8% | 10.3% |
Similar Demographics by 2 or more Vehicles in Household
Demographics Similar to Somalis by 2 or more Vehicles in Household
In terms of 2 or more vehicles in household, the demographic groups most similar to Somalis are Immigrants from Panama (51.1%, a difference of 0.060%), Belizean (51.0%, a difference of 0.10%), Okinawan (51.2%, a difference of 0.28%), Immigrants from Serbia (51.3%, a difference of 0.40%), and Immigrants from Liberia (51.3%, a difference of 0.42%).
| Demographics | Rating | Rank | 2 or more Vehicles in Household |
| Bahamians | 0.1 /100 | #282 | Tragic 51.5% |
| Immigrants | China | 0.1 /100 | #283 | Tragic 51.5% |
| Immigrants | Zaire | 0.1 /100 | #284 | Tragic 51.5% |
| Immigrants | Uruguay | 0.1 /100 | #285 | Tragic 51.4% |
| Immigrants | Liberia | 0.1 /100 | #286 | Tragic 51.3% |
| Immigrants | Serbia | 0.1 /100 | #287 | Tragic 51.3% |
| Okinawans | 0.1 /100 | #288 | Tragic 51.2% |
| Somalis | 0.0 /100 | #289 | Tragic 51.1% |
| Immigrants | Panama | 0.0 /100 | #290 | Tragic 51.1% |
| Belizeans | 0.0 /100 | #291 | Tragic 51.0% |
| Immigrants | Ukraine | 0.0 /100 | #292 | Tragic 50.9% |
| Blacks/African Americans | 0.0 /100 | #293 | Tragic 50.9% |
| Bermudans | 0.0 /100 | #294 | Tragic 50.6% |
| Cypriots | 0.0 /100 | #295 | Tragic 50.6% |
| Immigrants | Somalia | 0.0 /100 | #296 | Tragic 50.5% |
Demographics Similar to Immigrants from Sierra Leone by 2 or more Vehicles in Household
In terms of 2 or more vehicles in household, the demographic groups most similar to Immigrants from Sierra Leone are Immigrants from Eastern Asia (53.2%, a difference of 0.0%), Immigrants from Europe (53.2%, a difference of 0.030%), Immigrants from Armenia (53.3%, a difference of 0.10%), Cambodian (53.3%, a difference of 0.10%), and Macedonian (53.3%, a difference of 0.17%).
| Demographics | Rating | Rank | 2 or more Vehicles in Household |
| Immigrants | Switzerland | 3.0 /100 | #234 | Tragic 53.4% |
| Immigrants | Middle Africa | 3.0 /100 | #235 | Tragic 53.4% |
| Indonesians | 2.7 /100 | #236 | Tragic 53.4% |
| Macedonians | 2.4 /100 | #237 | Tragic 53.3% |
| Immigrants | Armenia | 2.3 /100 | #238 | Tragic 53.3% |
| Cambodians | 2.3 /100 | #239 | Tragic 53.3% |
| Immigrants | Europe | 2.1 /100 | #240 | Tragic 53.2% |
| Immigrants | Sierra Leone | 2.1 /100 | #241 | Tragic 53.2% |
| Immigrants | Eastern Asia | 2.1 /100 | #242 | Tragic 53.2% |
| Ethiopians | 1.7 /100 | #243 | Tragic 53.1% |
| Indians (Asian) | 1.7 /100 | #244 | Tragic 53.1% |
| Immigrants | Ethiopia | 1.5 /100 | #245 | Tragic 53.0% |
| Immigrants | Nigeria | 1.2 /100 | #246 | Tragic 52.9% |
| Sierra Leoneans | 1.2 /100 | #247 | Tragic 52.9% |
| Colombians | 1.1 /100 | #248 | Tragic 52.9% |