Somali vs Seminole 2 or more Vehicles in Household
COMPARE
Somali
Seminole
2 or more Vehicles in Household
2 or more Vehicles in Household Comparison
Somalis
Seminole
51.1%
2 OR MORE VEHICLES IN HOUSEHOLD
0.0/ 100
METRIC RATING
289th/ 347
METRIC RANK
56.2%
2 OR MORE VEHICLES IN HOUSEHOLD
81.7/ 100
METRIC RATING
143rd/ 347
METRIC RANK
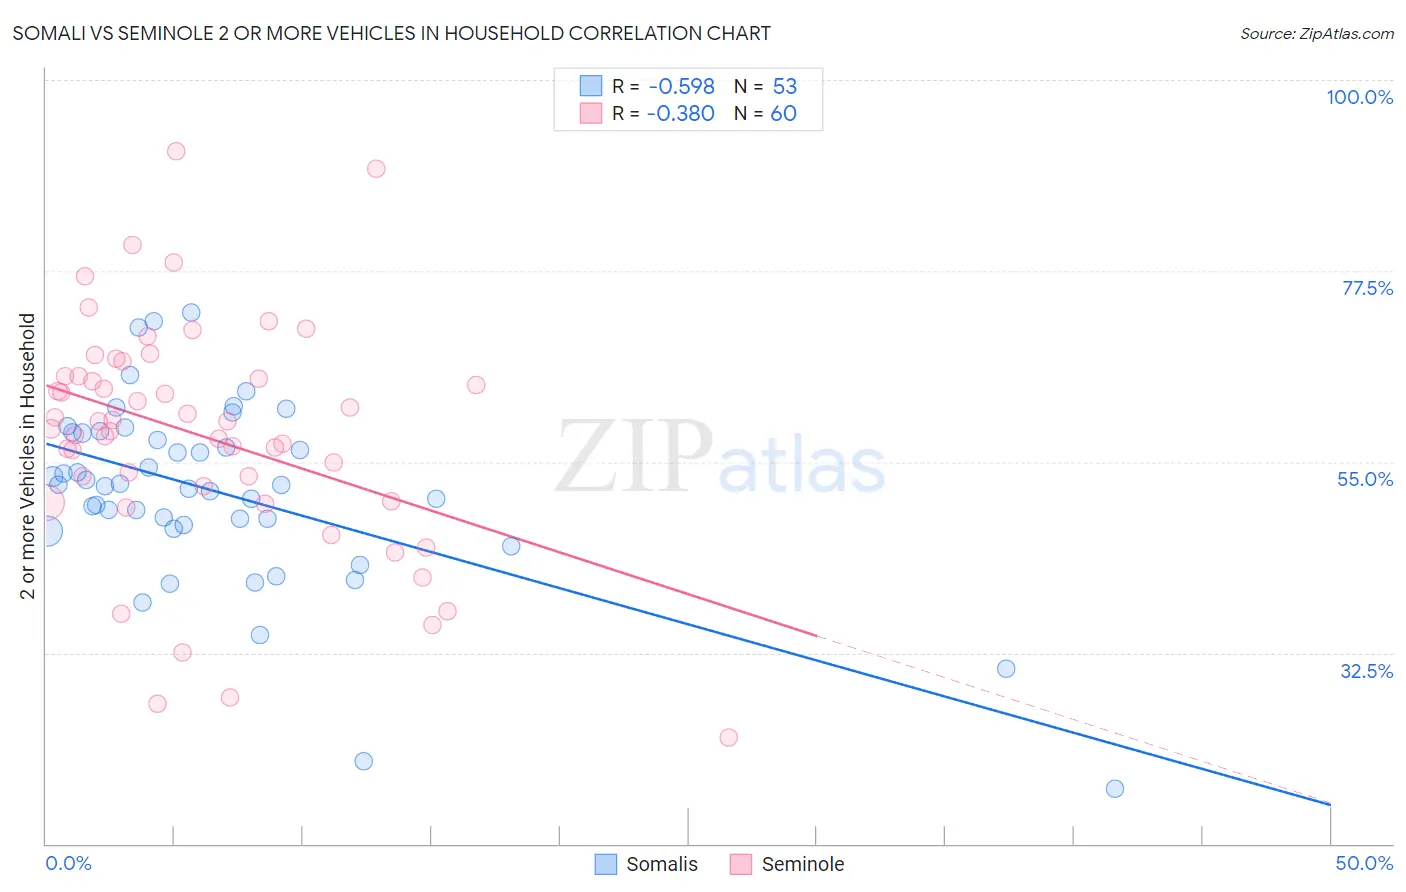
Somali vs Seminole 2 or more Vehicles in Household Correlation Chart
The statistical analysis conducted on geographies consisting of 99,288,956 people shows a substantial negative correlation between the proportion of Somalis and percentage of households with 2 or more vehicles available in the United States with a correlation coefficient (R) of -0.598 and weighted average of 51.1%. Similarly, the statistical analysis conducted on geographies consisting of 118,307,027 people shows a mild negative correlation between the proportion of Seminole and percentage of households with 2 or more vehicles available in the United States with a correlation coefficient (R) of -0.380 and weighted average of 56.2%, a difference of 9.9%.
2 or more Vehicles in Household Correlation Summary
| Measurement | Somali | Seminole |
| Minimum | 16.4% | 22.6% |
| Maximum | 72.6% | 91.7% |
| Range | 56.2% | 69.1% |
| Mean | 51.4% | 58.0% |
| Median | 52.2% | 59.3% |
| Interquartile 25% (IQ1) | 47.3% | 51.3% |
| Interquartile 75% (IQ3) | 58.4% | 65.0% |
| Interquartile Range (IQR) | 11.1% | 13.7% |
| Standard Deviation (Sample) | 10.9% | 13.9% |
| Standard Deviation (Population) | 10.8% | 13.8% |
Similar Demographics by 2 or more Vehicles in Household
Demographics Similar to Somalis by 2 or more Vehicles in Household
In terms of 2 or more vehicles in household, the demographic groups most similar to Somalis are Immigrants from Panama (51.1%, a difference of 0.060%), Belizean (51.0%, a difference of 0.10%), Okinawan (51.2%, a difference of 0.28%), Immigrants from Serbia (51.3%, a difference of 0.40%), and Immigrants from Liberia (51.3%, a difference of 0.42%).
| Demographics | Rating | Rank | 2 or more Vehicles in Household |
| Bahamians | 0.1 /100 | #282 | Tragic 51.5% |
| Immigrants | China | 0.1 /100 | #283 | Tragic 51.5% |
| Immigrants | Zaire | 0.1 /100 | #284 | Tragic 51.5% |
| Immigrants | Uruguay | 0.1 /100 | #285 | Tragic 51.4% |
| Immigrants | Liberia | 0.1 /100 | #286 | Tragic 51.3% |
| Immigrants | Serbia | 0.1 /100 | #287 | Tragic 51.3% |
| Okinawans | 0.1 /100 | #288 | Tragic 51.2% |
| Somalis | 0.0 /100 | #289 | Tragic 51.1% |
| Immigrants | Panama | 0.0 /100 | #290 | Tragic 51.1% |
| Belizeans | 0.0 /100 | #291 | Tragic 51.0% |
| Immigrants | Ukraine | 0.0 /100 | #292 | Tragic 50.9% |
| Blacks/African Americans | 0.0 /100 | #293 | Tragic 50.9% |
| Bermudans | 0.0 /100 | #294 | Tragic 50.6% |
| Cypriots | 0.0 /100 | #295 | Tragic 50.6% |
| Immigrants | Somalia | 0.0 /100 | #296 | Tragic 50.5% |
Demographics Similar to Seminole by 2 or more Vehicles in Household
In terms of 2 or more vehicles in household, the demographic groups most similar to Seminole are Immigrants from Syria (56.2%, a difference of 0.020%), Syrian (56.2%, a difference of 0.030%), Venezuelan (56.1%, a difference of 0.070%), South African (56.2%, a difference of 0.090%), and Serbian (56.1%, a difference of 0.090%).
| Demographics | Rating | Rank | 2 or more Vehicles in Household |
| Immigrants | Asia | 86.0 /100 | #136 | Excellent 56.3% |
| Cubans | 84.8 /100 | #137 | Excellent 56.3% |
| Salvadorans | 84.7 /100 | #138 | Excellent 56.3% |
| Armenians | 84.3 /100 | #139 | Excellent 56.3% |
| Latvians | 83.6 /100 | #140 | Excellent 56.2% |
| Immigrants | Cambodia | 83.6 /100 | #141 | Excellent 56.2% |
| South Africans | 83.1 /100 | #142 | Excellent 56.2% |
| Seminole | 81.7 /100 | #143 | Excellent 56.2% |
| Immigrants | Syria | 81.4 /100 | #144 | Excellent 56.2% |
| Syrians | 81.2 /100 | #145 | Excellent 56.2% |
| Venezuelans | 80.7 /100 | #146 | Excellent 56.1% |
| Serbians | 80.3 /100 | #147 | Excellent 56.1% |
| Immigrants | Moldova | 80.2 /100 | #148 | Excellent 56.1% |
| Chileans | 80.2 /100 | #149 | Excellent 56.1% |
| Nicaraguans | 79.9 /100 | #150 | Good 56.1% |