Somali vs Central American 2 or more Vehicles in Household
COMPARE
Somali
Central American
2 or more Vehicles in Household
2 or more Vehicles in Household Comparison
Somalis
Central Americans
51.1%
2 OR MORE VEHICLES IN HOUSEHOLD
0.0/ 100
METRIC RATING
289th/ 347
METRIC RANK
54.7%
2 OR MORE VEHICLES IN HOUSEHOLD
23.0/ 100
METRIC RATING
194th/ 347
METRIC RANK
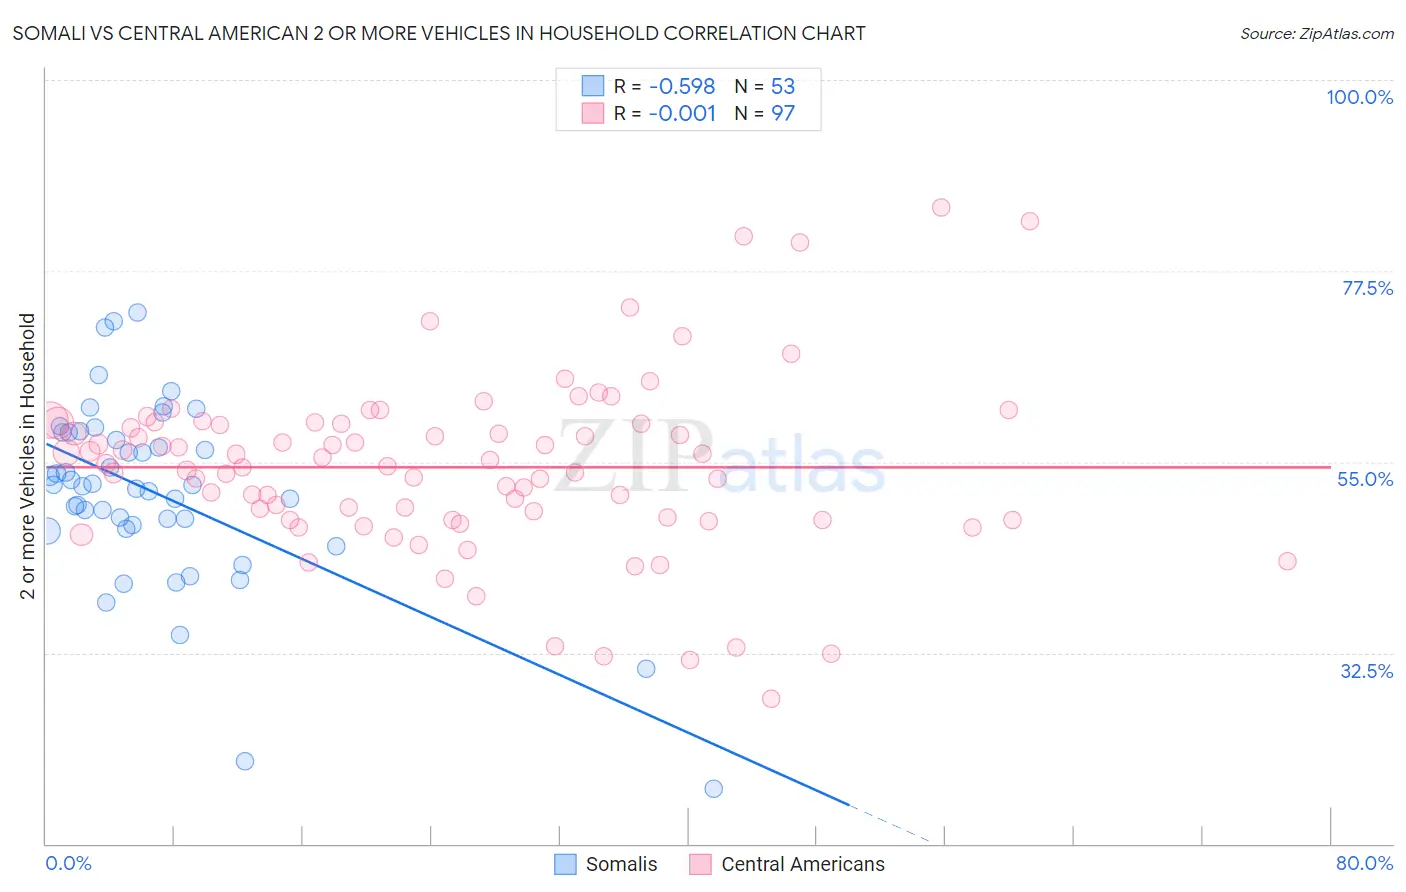
Somali vs Central American 2 or more Vehicles in Household Correlation Chart
The statistical analysis conducted on geographies consisting of 99,288,956 people shows a substantial negative correlation between the proportion of Somalis and percentage of households with 2 or more vehicles available in the United States with a correlation coefficient (R) of -0.598 and weighted average of 51.1%. Similarly, the statistical analysis conducted on geographies consisting of 504,126,351 people shows no correlation between the proportion of Central Americans and percentage of households with 2 or more vehicles available in the United States with a correlation coefficient (R) of -0.001 and weighted average of 54.7%, a difference of 7.0%.
2 or more Vehicles in Household Correlation Summary
| Measurement | Somali | Central American |
| Minimum | 16.4% | 27.0% |
| Maximum | 72.6% | 85.0% |
| Range | 56.2% | 58.0% |
| Mean | 51.4% | 54.4% |
| Median | 52.2% | 54.7% |
| Interquartile 25% (IQ1) | 47.3% | 48.2% |
| Interquartile 75% (IQ3) | 58.4% | 59.5% |
| Interquartile Range (IQR) | 11.1% | 11.3% |
| Standard Deviation (Sample) | 10.9% | 10.4% |
| Standard Deviation (Population) | 10.8% | 10.3% |
Similar Demographics by 2 or more Vehicles in Household
Demographics Similar to Somalis by 2 or more Vehicles in Household
In terms of 2 or more vehicles in household, the demographic groups most similar to Somalis are Immigrants from Panama (51.1%, a difference of 0.060%), Belizean (51.0%, a difference of 0.10%), Okinawan (51.2%, a difference of 0.28%), Immigrants from Serbia (51.3%, a difference of 0.40%), and Immigrants from Liberia (51.3%, a difference of 0.42%).
| Demographics | Rating | Rank | 2 or more Vehicles in Household |
| Bahamians | 0.1 /100 | #282 | Tragic 51.5% |
| Immigrants | China | 0.1 /100 | #283 | Tragic 51.5% |
| Immigrants | Zaire | 0.1 /100 | #284 | Tragic 51.5% |
| Immigrants | Uruguay | 0.1 /100 | #285 | Tragic 51.4% |
| Immigrants | Liberia | 0.1 /100 | #286 | Tragic 51.3% |
| Immigrants | Serbia | 0.1 /100 | #287 | Tragic 51.3% |
| Okinawans | 0.1 /100 | #288 | Tragic 51.2% |
| Somalis | 0.0 /100 | #289 | Tragic 51.1% |
| Immigrants | Panama | 0.0 /100 | #290 | Tragic 51.1% |
| Belizeans | 0.0 /100 | #291 | Tragic 51.0% |
| Immigrants | Ukraine | 0.0 /100 | #292 | Tragic 50.9% |
| Blacks/African Americans | 0.0 /100 | #293 | Tragic 50.9% |
| Bermudans | 0.0 /100 | #294 | Tragic 50.6% |
| Cypriots | 0.0 /100 | #295 | Tragic 50.6% |
| Immigrants | Somalia | 0.0 /100 | #296 | Tragic 50.5% |
Demographics Similar to Central Americans by 2 or more Vehicles in Household
In terms of 2 or more vehicles in household, the demographic groups most similar to Central Americans are Immigrants from Japan (54.7%, a difference of 0.020%), Iroquois (54.7%, a difference of 0.030%), Immigrants from Romania (54.7%, a difference of 0.050%), Immigrants (54.7%, a difference of 0.11%), and Russian (54.8%, a difference of 0.18%).
| Demographics | Rating | Rank | 2 or more Vehicles in Household |
| Immigrants | Uganda | 33.4 /100 | #187 | Fair 55.0% |
| Marshallese | 30.5 /100 | #188 | Fair 54.9% |
| Eastern Europeans | 27.5 /100 | #189 | Fair 54.8% |
| Russians | 26.3 /100 | #190 | Fair 54.8% |
| Immigrants | Immigrants | 25.0 /100 | #191 | Fair 54.7% |
| Immigrants | Romania | 23.8 /100 | #192 | Fair 54.7% |
| Immigrants | Japan | 23.4 /100 | #193 | Fair 54.7% |
| Central Americans | 23.0 /100 | #194 | Fair 54.7% |
| Iroquois | 22.6 /100 | #195 | Fair 54.7% |
| Immigrants | Poland | 19.3 /100 | #196 | Poor 54.6% |
| Argentineans | 17.5 /100 | #197 | Poor 54.5% |
| Carpatho Rusyns | 16.2 /100 | #198 | Poor 54.4% |
| Immigrants | Norway | 15.9 /100 | #199 | Poor 54.4% |
| Houma | 15.8 /100 | #200 | Poor 54.4% |
| Immigrants | Italy | 15.5 /100 | #201 | Poor 54.4% |