Northern European vs English 2 or more Vehicles in Household
COMPARE
Northern European
English
2 or more Vehicles in Household
2 or more Vehicles in Household Comparison
Northern Europeans
English
59.9%
2 OR MORE VEHICLES IN HOUSEHOLD
100.0/ 100
METRIC RATING
41st/ 347
METRIC RANK
61.9%
2 OR MORE VEHICLES IN HOUSEHOLD
100.0/ 100
METRIC RATING
8th/ 347
METRIC RANK
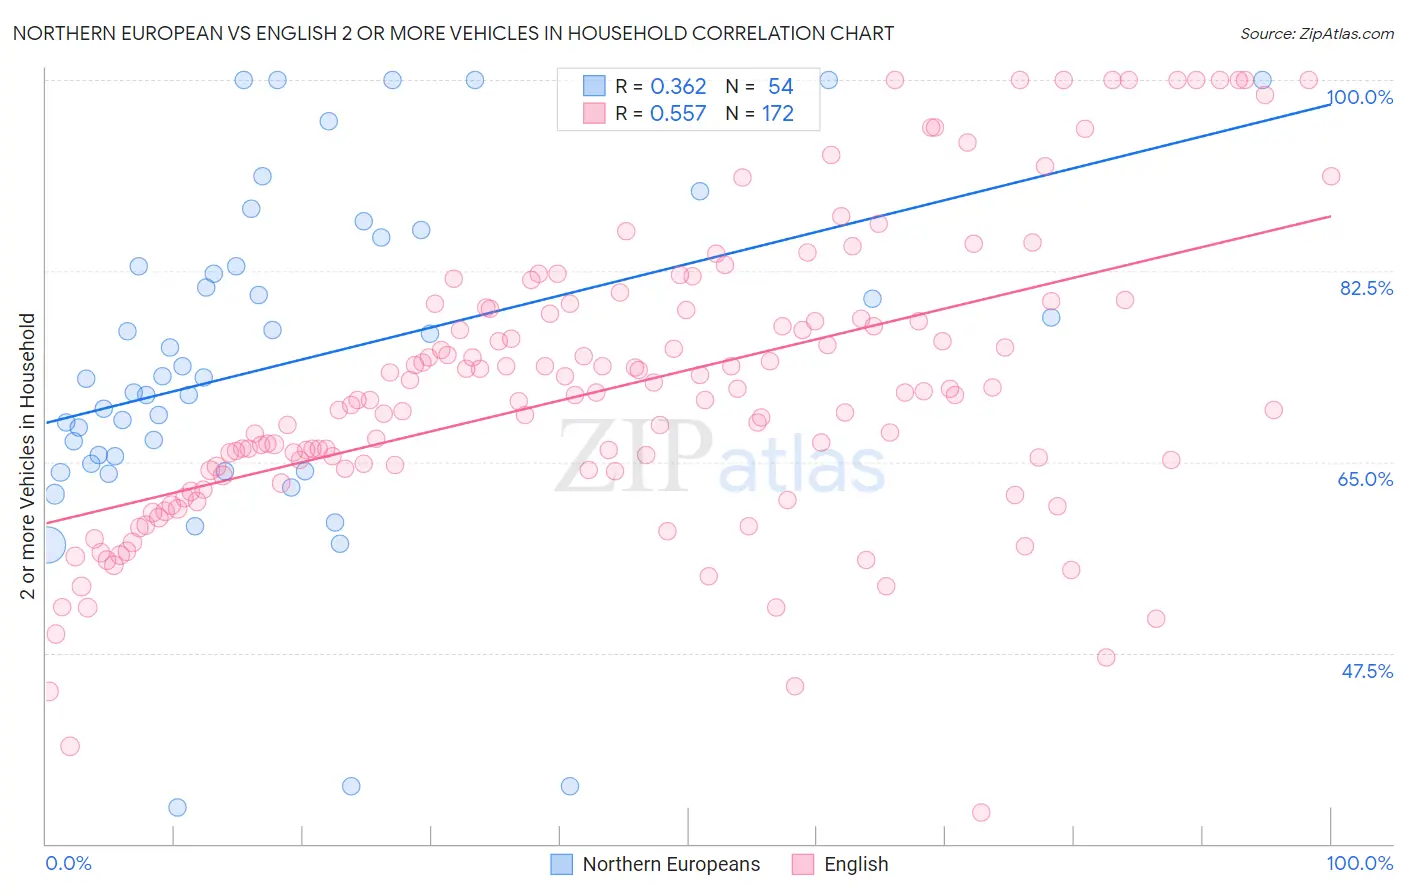
Northern European vs English 2 or more Vehicles in Household Correlation Chart
The statistical analysis conducted on geographies consisting of 405,957,597 people shows a mild positive correlation between the proportion of Northern Europeans and percentage of households with 2 or more vehicles available in the United States with a correlation coefficient (R) of 0.362 and weighted average of 59.9%. Similarly, the statistical analysis conducted on geographies consisting of 579,367,865 people shows a substantial positive correlation between the proportion of English and percentage of households with 2 or more vehicles available in the United States with a correlation coefficient (R) of 0.557 and weighted average of 61.9%, a difference of 3.4%.
2 or more Vehicles in Household Correlation Summary
| Measurement | Northern European | English |
| Minimum | 33.3% | 32.9% |
| Maximum | 100.0% | 100.0% |
| Range | 66.7% | 67.1% |
| Mean | 74.0% | 71.7% |
| Median | 72.7% | 70.9% |
| Interquartile 25% (IQ1) | 64.8% | 64.2% |
| Interquartile 75% (IQ3) | 83.0% | 78.8% |
| Interquartile Range (IQR) | 18.1% | 14.6% |
| Standard Deviation (Sample) | 15.6% | 13.3% |
| Standard Deviation (Population) | 15.5% | 13.3% |
Similar Demographics by 2 or more Vehicles in Household
Demographics Similar to Northern Europeans by 2 or more Vehicles in Household
In terms of 2 or more vehicles in household, the demographic groups most similar to Northern Europeans are Malaysian (59.8%, a difference of 0.010%), Cherokee (59.9%, a difference of 0.020%), Czechoslovakian (59.8%, a difference of 0.090%), French (59.8%, a difference of 0.15%), and Immigrants from Taiwan (59.7%, a difference of 0.19%).
| Demographics | Rating | Rank | 2 or more Vehicles in Household |
| Spanish | 100.0 /100 | #34 | Exceptional 60.2% |
| Immigrants | Philippines | 100.0 /100 | #35 | Exceptional 60.1% |
| Chinese | 100.0 /100 | #36 | Exceptional 60.1% |
| Irish | 100.0 /100 | #37 | Exceptional 60.1% |
| Americans | 100.0 /100 | #38 | Exceptional 60.0% |
| British | 100.0 /100 | #39 | Exceptional 60.0% |
| Cherokee | 100.0 /100 | #40 | Exceptional 59.9% |
| Northern Europeans | 100.0 /100 | #41 | Exceptional 59.9% |
| Malaysians | 100.0 /100 | #42 | Exceptional 59.8% |
| Czechoslovakians | 100.0 /100 | #43 | Exceptional 59.8% |
| French | 100.0 /100 | #44 | Exceptional 59.8% |
| Immigrants | Taiwan | 100.0 /100 | #45 | Exceptional 59.7% |
| Immigrants | South Eastern Asia | 100.0 /100 | #46 | Exceptional 59.6% |
| Yaqui | 99.9 /100 | #47 | Exceptional 59.3% |
| Immigrants | India | 99.9 /100 | #48 | Exceptional 59.3% |
Demographics Similar to English by 2 or more Vehicles in Household
In terms of 2 or more vehicles in household, the demographic groups most similar to English are Swedish (61.8%, a difference of 0.070%), Puget Sound Salish (62.1%, a difference of 0.27%), Scandinavian (62.1%, a difference of 0.33%), Mexican (61.7%, a difference of 0.35%), and Dutch (61.6%, a difference of 0.40%).
| Demographics | Rating | Rank | 2 or more Vehicles in Household |
| Yakama | 100.0 /100 | #1 | Exceptional 64.9% |
| Tongans | 100.0 /100 | #2 | Exceptional 63.5% |
| Danes | 100.0 /100 | #3 | Exceptional 63.3% |
| Norwegians | 100.0 /100 | #4 | Exceptional 62.8% |
| Immigrants | Fiji | 100.0 /100 | #5 | Exceptional 62.3% |
| Scandinavians | 100.0 /100 | #6 | Exceptional 62.1% |
| Puget Sound Salish | 100.0 /100 | #7 | Exceptional 62.1% |
| English | 100.0 /100 | #8 | Exceptional 61.9% |
| Swedes | 100.0 /100 | #9 | Exceptional 61.8% |
| Mexicans | 100.0 /100 | #10 | Exceptional 61.7% |
| Dutch | 100.0 /100 | #11 | Exceptional 61.6% |
| Germans | 100.0 /100 | #12 | Exceptional 61.6% |
| Samoans | 100.0 /100 | #13 | Exceptional 61.5% |
| Czechs | 100.0 /100 | #14 | Exceptional 61.5% |
| Nepalese | 100.0 /100 | #15 | Exceptional 61.4% |