Northern European vs Brazilian 2 or more Vehicles in Household
COMPARE
Northern European
Brazilian
2 or more Vehicles in Household
2 or more Vehicles in Household Comparison
Northern Europeans
Brazilians
59.9%
2 OR MORE VEHICLES IN HOUSEHOLD
100.0/ 100
METRIC RATING
41st/ 347
METRIC RANK
53.8%
2 OR MORE VEHICLES IN HOUSEHOLD
5.3/ 100
METRIC RATING
224th/ 347
METRIC RANK
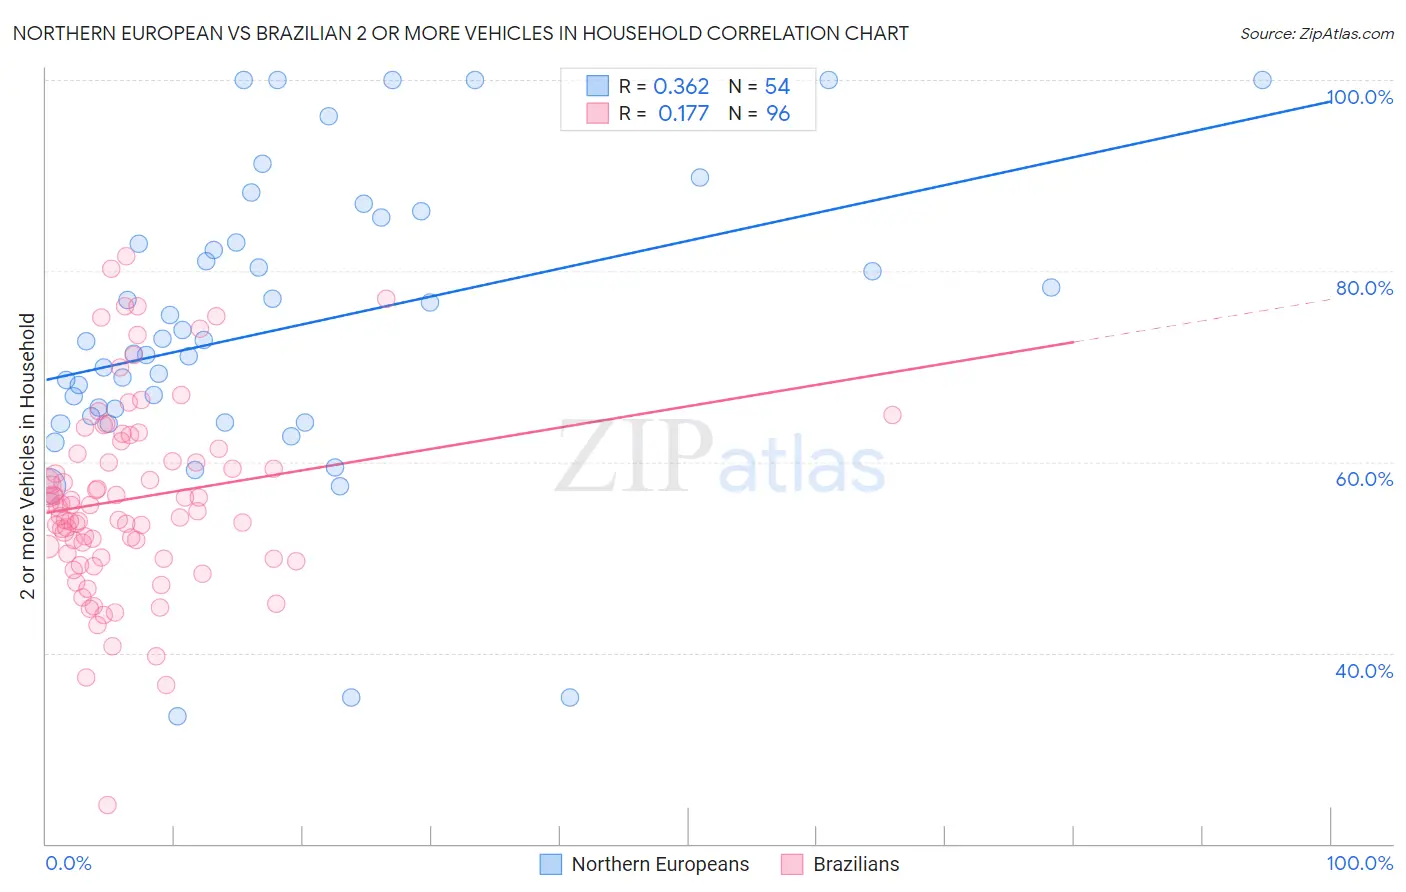
Northern European vs Brazilian 2 or more Vehicles in Household Correlation Chart
The statistical analysis conducted on geographies consisting of 405,957,597 people shows a mild positive correlation between the proportion of Northern Europeans and percentage of households with 2 or more vehicles available in the United States with a correlation coefficient (R) of 0.362 and weighted average of 59.9%. Similarly, the statistical analysis conducted on geographies consisting of 323,674,427 people shows a poor positive correlation between the proportion of Brazilians and percentage of households with 2 or more vehicles available in the United States with a correlation coefficient (R) of 0.177 and weighted average of 53.8%, a difference of 11.3%.
2 or more Vehicles in Household Correlation Summary
| Measurement | Northern European | Brazilian |
| Minimum | 33.3% | 24.1% |
| Maximum | 100.0% | 81.5% |
| Range | 66.7% | 57.4% |
| Mean | 74.0% | 56.1% |
| Median | 72.7% | 55.4% |
| Interquartile 25% (IQ1) | 64.8% | 50.2% |
| Interquartile 75% (IQ3) | 83.0% | 61.1% |
| Interquartile Range (IQR) | 18.1% | 10.9% |
| Standard Deviation (Sample) | 15.6% | 10.0% |
| Standard Deviation (Population) | 15.5% | 9.9% |
Similar Demographics by 2 or more Vehicles in Household
Demographics Similar to Northern Europeans by 2 or more Vehicles in Household
In terms of 2 or more vehicles in household, the demographic groups most similar to Northern Europeans are Malaysian (59.8%, a difference of 0.010%), Cherokee (59.9%, a difference of 0.020%), Czechoslovakian (59.8%, a difference of 0.090%), French (59.8%, a difference of 0.15%), and Immigrants from Taiwan (59.7%, a difference of 0.19%).
| Demographics | Rating | Rank | 2 or more Vehicles in Household |
| Spanish | 100.0 /100 | #34 | Exceptional 60.2% |
| Immigrants | Philippines | 100.0 /100 | #35 | Exceptional 60.1% |
| Chinese | 100.0 /100 | #36 | Exceptional 60.1% |
| Irish | 100.0 /100 | #37 | Exceptional 60.1% |
| Americans | 100.0 /100 | #38 | Exceptional 60.0% |
| British | 100.0 /100 | #39 | Exceptional 60.0% |
| Cherokee | 100.0 /100 | #40 | Exceptional 59.9% |
| Northern Europeans | 100.0 /100 | #41 | Exceptional 59.9% |
| Malaysians | 100.0 /100 | #42 | Exceptional 59.8% |
| Czechoslovakians | 100.0 /100 | #43 | Exceptional 59.8% |
| French | 100.0 /100 | #44 | Exceptional 59.8% |
| Immigrants | Taiwan | 100.0 /100 | #45 | Exceptional 59.7% |
| Immigrants | South Eastern Asia | 100.0 /100 | #46 | Exceptional 59.6% |
| Yaqui | 99.9 /100 | #47 | Exceptional 59.3% |
| Immigrants | India | 99.9 /100 | #48 | Exceptional 59.3% |
Demographics Similar to Brazilians by 2 or more Vehicles in Household
In terms of 2 or more vehicles in household, the demographic groups most similar to Brazilians are Immigrants from Egypt (53.8%, a difference of 0.010%), Immigrants from Eastern Africa (53.7%, a difference of 0.030%), Immigrants from Bosnia and Herzegovina (53.8%, a difference of 0.040%), Kiowa (53.9%, a difference of 0.17%), and Immigrants from Singapore (53.9%, a difference of 0.19%).
| Demographics | Rating | Rank | 2 or more Vehicles in Household |
| Immigrants | Burma/Myanmar | 7.1 /100 | #217 | Tragic 53.9% |
| Immigrants | Argentina | 6.8 /100 | #218 | Tragic 53.9% |
| South American Indians | 6.5 /100 | #219 | Tragic 53.9% |
| Taiwanese | 6.3 /100 | #220 | Tragic 53.9% |
| Immigrants | Singapore | 6.3 /100 | #221 | Tragic 53.9% |
| Kiowa | 6.2 /100 | #222 | Tragic 53.9% |
| Immigrants | Bosnia and Herzegovina | 5.5 /100 | #223 | Tragic 53.8% |
| Brazilians | 5.3 /100 | #224 | Tragic 53.8% |
| Immigrants | Egypt | 5.2 /100 | #225 | Tragic 53.8% |
| Immigrants | Eastern Africa | 5.1 /100 | #226 | Tragic 53.7% |
| Sudanese | 4.1 /100 | #227 | Tragic 53.6% |
| Alaska Natives | 3.9 /100 | #228 | Tragic 53.6% |
| Immigrants | Turkey | 3.8 /100 | #229 | Tragic 53.6% |
| Immigrants | Nepal | 3.6 /100 | #230 | Tragic 53.5% |
| Panamanians | 3.4 /100 | #231 | Tragic 53.5% |