Nigerian vs Immigrants from Philippines 2 or more Vehicles in Household
COMPARE
Nigerian
Immigrants from Philippines
2 or more Vehicles in Household
2 or more Vehicles in Household Comparison
Nigerians
Immigrants from Philippines
52.8%
2 OR MORE VEHICLES IN HOUSEHOLD
0.9/ 100
METRIC RATING
253rd/ 347
METRIC RANK
60.1%
2 OR MORE VEHICLES IN HOUSEHOLD
100.0/ 100
METRIC RATING
35th/ 347
METRIC RANK
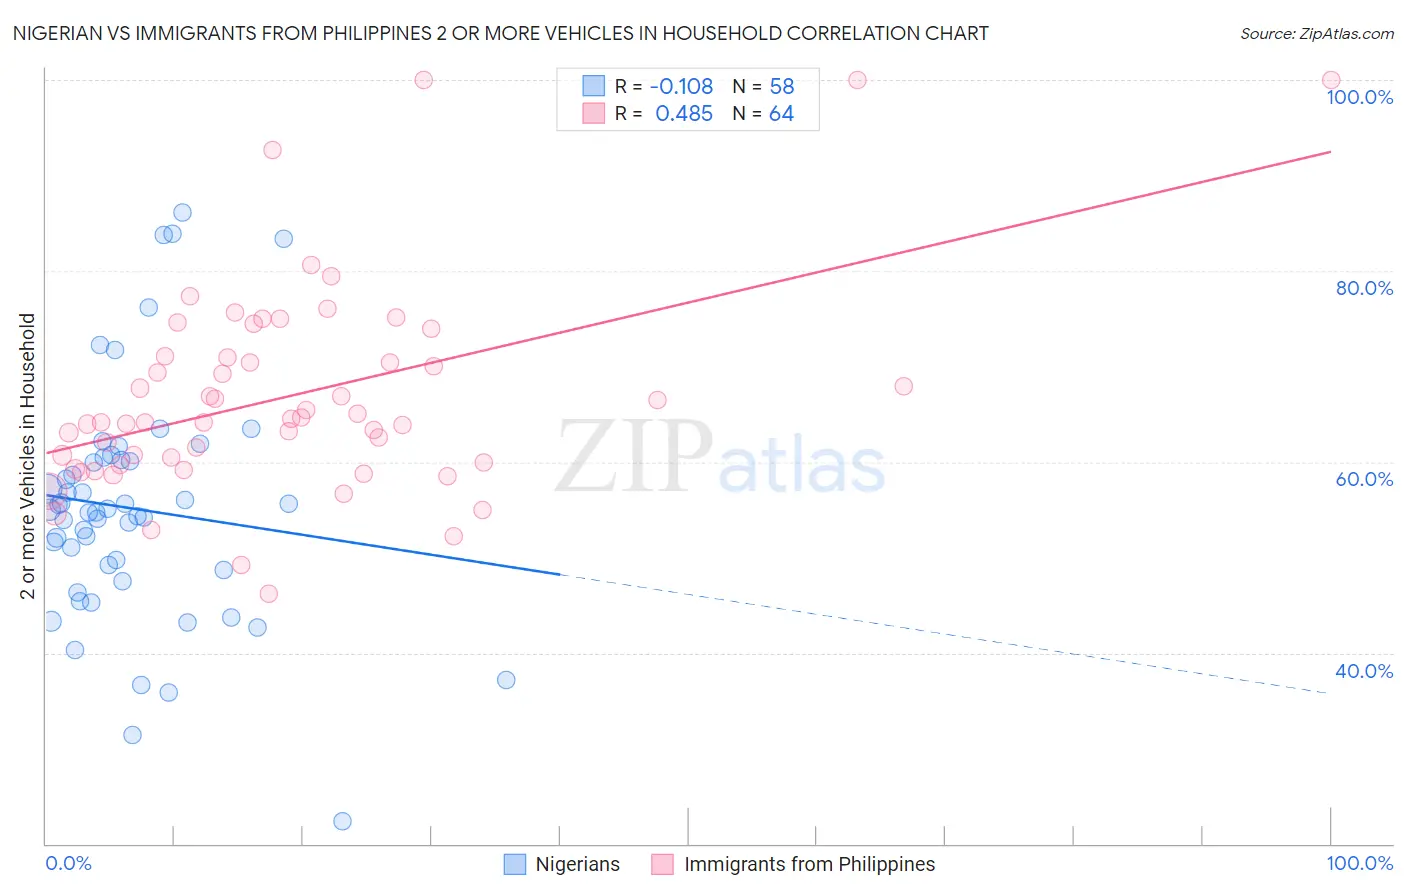
Nigerian vs Immigrants from Philippines 2 or more Vehicles in Household Correlation Chart
The statistical analysis conducted on geographies consisting of 332,498,440 people shows a poor negative correlation between the proportion of Nigerians and percentage of households with 2 or more vehicles available in the United States with a correlation coefficient (R) of -0.108 and weighted average of 52.8%. Similarly, the statistical analysis conducted on geographies consisting of 471,056,019 people shows a moderate positive correlation between the proportion of Immigrants from Philippines and percentage of households with 2 or more vehicles available in the United States with a correlation coefficient (R) of 0.485 and weighted average of 60.1%, a difference of 13.9%.
2 or more Vehicles in Household Correlation Summary
| Measurement | Nigerian | Immigrants from Philippines |
| Minimum | 22.3% | 46.2% |
| Maximum | 86.1% | 100.0% |
| Range | 63.8% | 53.8% |
| Mean | 55.1% | 66.9% |
| Median | 54.8% | 64.3% |
| Interquartile 25% (IQ1) | 48.7% | 59.8% |
| Interquartile 75% (IQ3) | 60.2% | 71.0% |
| Interquartile Range (IQR) | 11.5% | 11.2% |
| Standard Deviation (Sample) | 12.4% | 10.9% |
| Standard Deviation (Population) | 12.3% | 10.8% |
Similar Demographics by 2 or more Vehicles in Household
Demographics Similar to Nigerians by 2 or more Vehicles in Household
In terms of 2 or more vehicles in household, the demographic groups most similar to Nigerians are Immigrants from Portugal (52.8%, a difference of 0.050%), Immigrants from Sudan (52.8%, a difference of 0.060%), Immigrants from Brazil (52.8%, a difference of 0.10%), Mongolian (52.8%, a difference of 0.10%), and Colombian (52.9%, a difference of 0.15%).
| Demographics | Rating | Rank | 2 or more Vehicles in Household |
| Immigrants | Nigeria | 1.2 /100 | #246 | Tragic 52.9% |
| Sierra Leoneans | 1.2 /100 | #247 | Tragic 52.9% |
| Colombians | 1.1 /100 | #248 | Tragic 52.9% |
| Immigrants | Brazil | 1.0 /100 | #249 | Tragic 52.8% |
| Mongolians | 1.0 /100 | #250 | Tragic 52.8% |
| Immigrants | Sudan | 1.0 /100 | #251 | Tragic 52.8% |
| Immigrants | Portugal | 1.0 /100 | #252 | Tragic 52.8% |
| Nigerians | 0.9 /100 | #253 | Tragic 52.8% |
| Immigrants | Malaysia | 0.8 /100 | #254 | Tragic 52.7% |
| Uruguayans | 0.7 /100 | #255 | Tragic 52.7% |
| Immigrants | Eritrea | 0.7 /100 | #256 | Tragic 52.6% |
| Immigrants | Hong Kong | 0.6 /100 | #257 | Tragic 52.6% |
| Central American Indians | 0.6 /100 | #258 | Tragic 52.5% |
| Alsatians | 0.6 /100 | #259 | Tragic 52.5% |
| Immigrants | Bahamas | 0.5 /100 | #260 | Tragic 52.5% |
Demographics Similar to Immigrants from Philippines by 2 or more Vehicles in Household
In terms of 2 or more vehicles in household, the demographic groups most similar to Immigrants from Philippines are Chinese (60.1%, a difference of 0.020%), Irish (60.1%, a difference of 0.060%), Spanish (60.2%, a difference of 0.12%), American (60.0%, a difference of 0.12%), and British (60.0%, a difference of 0.12%).
| Demographics | Rating | Rank | 2 or more Vehicles in Household |
| Guamanians/Chamorros | 100.0 /100 | #28 | Exceptional 60.5% |
| Hawaiians | 100.0 /100 | #29 | Exceptional 60.4% |
| Finns | 100.0 /100 | #30 | Exceptional 60.3% |
| Spanish American Indians | 100.0 /100 | #31 | Exceptional 60.3% |
| Arapaho | 100.0 /100 | #32 | Exceptional 60.2% |
| Immigrants | Mexico | 100.0 /100 | #33 | Exceptional 60.2% |
| Spanish | 100.0 /100 | #34 | Exceptional 60.2% |
| Immigrants | Philippines | 100.0 /100 | #35 | Exceptional 60.1% |
| Chinese | 100.0 /100 | #36 | Exceptional 60.1% |
| Irish | 100.0 /100 | #37 | Exceptional 60.1% |
| Americans | 100.0 /100 | #38 | Exceptional 60.0% |
| British | 100.0 /100 | #39 | Exceptional 60.0% |
| Cherokee | 100.0 /100 | #40 | Exceptional 59.9% |
| Northern Europeans | 100.0 /100 | #41 | Exceptional 59.9% |
| Malaysians | 100.0 /100 | #42 | Exceptional 59.8% |