Nigerian vs Immigrants from Ireland 2 or more Vehicles in Household
COMPARE
Nigerian
Immigrants from Ireland
2 or more Vehicles in Household
2 or more Vehicles in Household Comparison
Nigerians
Immigrants from Ireland
52.8%
2 OR MORE VEHICLES IN HOUSEHOLD
0.9/ 100
METRIC RATING
253rd/ 347
METRIC RANK
52.0%
2 OR MORE VEHICLES IN HOUSEHOLD
0.2/ 100
METRIC RATING
270th/ 347
METRIC RANK
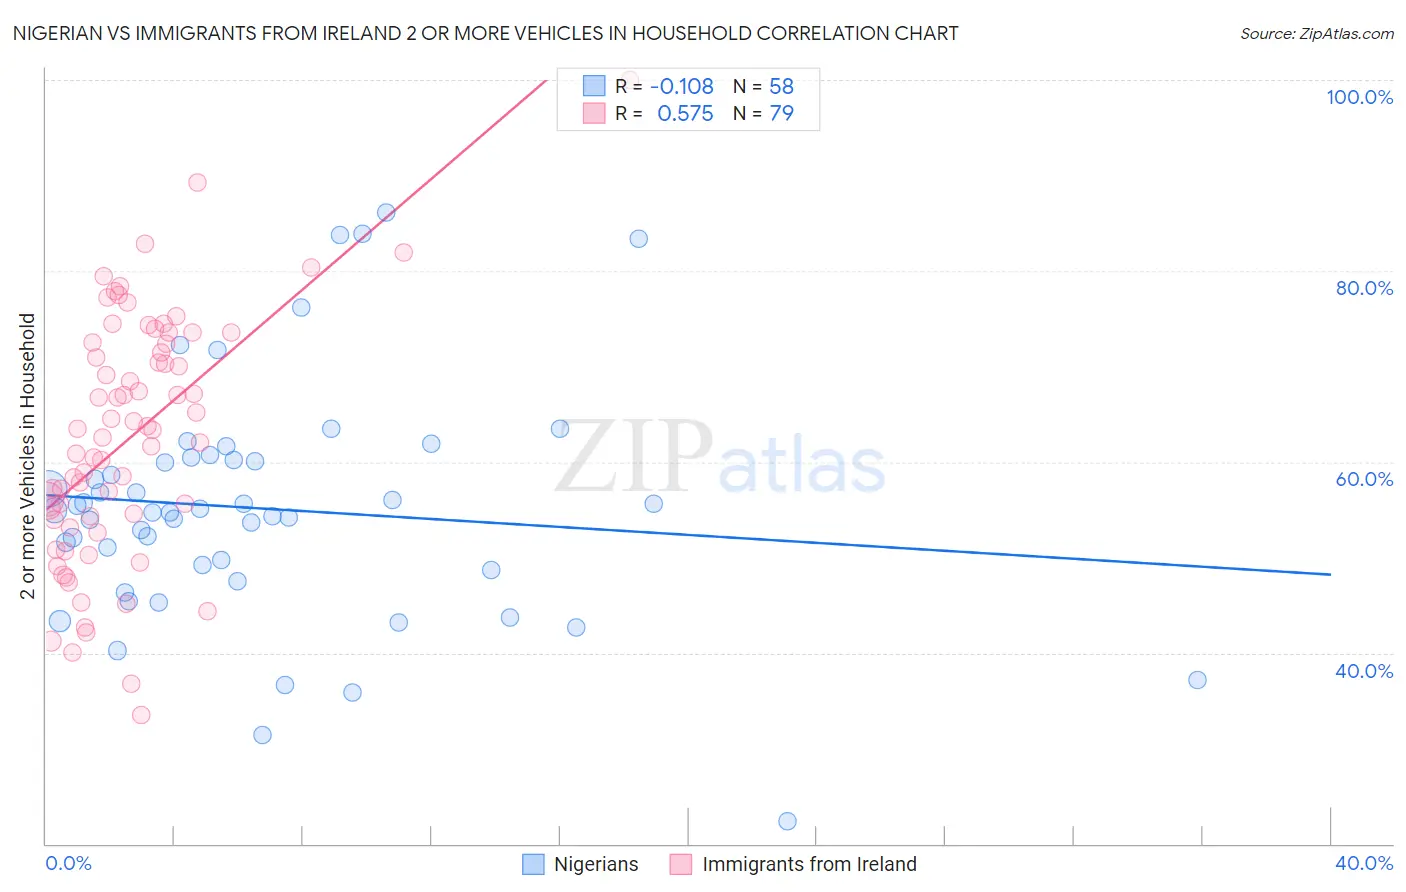
Nigerian vs Immigrants from Ireland 2 or more Vehicles in Household Correlation Chart
The statistical analysis conducted on geographies consisting of 332,498,440 people shows a poor negative correlation between the proportion of Nigerians and percentage of households with 2 or more vehicles available in the United States with a correlation coefficient (R) of -0.108 and weighted average of 52.8%. Similarly, the statistical analysis conducted on geographies consisting of 240,751,665 people shows a substantial positive correlation between the proportion of Immigrants from Ireland and percentage of households with 2 or more vehicles available in the United States with a correlation coefficient (R) of 0.575 and weighted average of 52.0%, a difference of 1.5%.
2 or more Vehicles in Household Correlation Summary
| Measurement | Nigerian | Immigrants from Ireland |
| Minimum | 22.3% | 33.5% |
| Maximum | 86.1% | 100.0% |
| Range | 63.8% | 66.5% |
| Mean | 55.1% | 62.6% |
| Median | 54.8% | 63.4% |
| Interquartile 25% (IQ1) | 48.7% | 53.9% |
| Interquartile 75% (IQ3) | 60.2% | 72.5% |
| Interquartile Range (IQR) | 11.5% | 18.5% |
| Standard Deviation (Sample) | 12.4% | 12.8% |
| Standard Deviation (Population) | 12.3% | 12.8% |
Demographics Similar to Nigerians and Immigrants from Ireland by 2 or more Vehicles in Household
In terms of 2 or more vehicles in household, the demographic groups most similar to Nigerians are Immigrants from Portugal (52.8%, a difference of 0.050%), Immigrants from Sudan (52.8%, a difference of 0.060%), Immigrants from Malaysia (52.7%, a difference of 0.19%), Uruguayan (52.7%, a difference of 0.22%), and Immigrants from Eritrea (52.6%, a difference of 0.26%). Similarly, the demographic groups most similar to Immigrants from Ireland are Honduran (52.0%, a difference of 0.020%), Pima (52.0%, a difference of 0.030%), Immigrants from Colombia (52.0%, a difference of 0.040%), Immigrants from France (52.0%, a difference of 0.080%), and South American (51.9%, a difference of 0.17%).
| Demographics | Rating | Rank | 2 or more Vehicles in Household |
| Immigrants | Sudan | 1.0 /100 | #251 | Tragic 52.8% |
| Immigrants | Portugal | 1.0 /100 | #252 | Tragic 52.8% |
| Nigerians | 0.9 /100 | #253 | Tragic 52.8% |
| Immigrants | Malaysia | 0.8 /100 | #254 | Tragic 52.7% |
| Uruguayans | 0.7 /100 | #255 | Tragic 52.7% |
| Immigrants | Eritrea | 0.7 /100 | #256 | Tragic 52.6% |
| Immigrants | Hong Kong | 0.6 /100 | #257 | Tragic 52.6% |
| Central American Indians | 0.6 /100 | #258 | Tragic 52.5% |
| Alsatians | 0.6 /100 | #259 | Tragic 52.5% |
| Immigrants | Bahamas | 0.5 /100 | #260 | Tragic 52.5% |
| Immigrants | Australia | 0.5 /100 | #261 | Tragic 52.4% |
| Immigrants | Northern Africa | 0.4 /100 | #262 | Tragic 52.3% |
| Immigrants | Southern Europe | 0.4 /100 | #263 | Tragic 52.3% |
| Immigrants | Latvia | 0.4 /100 | #264 | Tragic 52.2% |
| Immigrants | Congo | 0.3 /100 | #265 | Tragic 52.1% |
| Immigrants | France | 0.2 /100 | #266 | Tragic 52.0% |
| Immigrants | Colombia | 0.2 /100 | #267 | Tragic 52.0% |
| Pima | 0.2 /100 | #268 | Tragic 52.0% |
| Hondurans | 0.2 /100 | #269 | Tragic 52.0% |
| Immigrants | Ireland | 0.2 /100 | #270 | Tragic 52.0% |
| South Americans | 0.2 /100 | #271 | Tragic 51.9% |