Immigrants from Spain vs Immigrants from Austria 2 or more Vehicles in Household
COMPARE
Immigrants from Spain
Immigrants from Austria
2 or more Vehicles in Household
2 or more Vehicles in Household Comparison
Immigrants from Spain
Immigrants from Austria
50.4%
2 OR MORE VEHICLES IN HOUSEHOLD
0.0/ 100
METRIC RATING
297th/ 347
METRIC RANK
55.5%
2 OR MORE VEHICLES IN HOUSEHOLD
56.3/ 100
METRIC RATING
169th/ 347
METRIC RANK
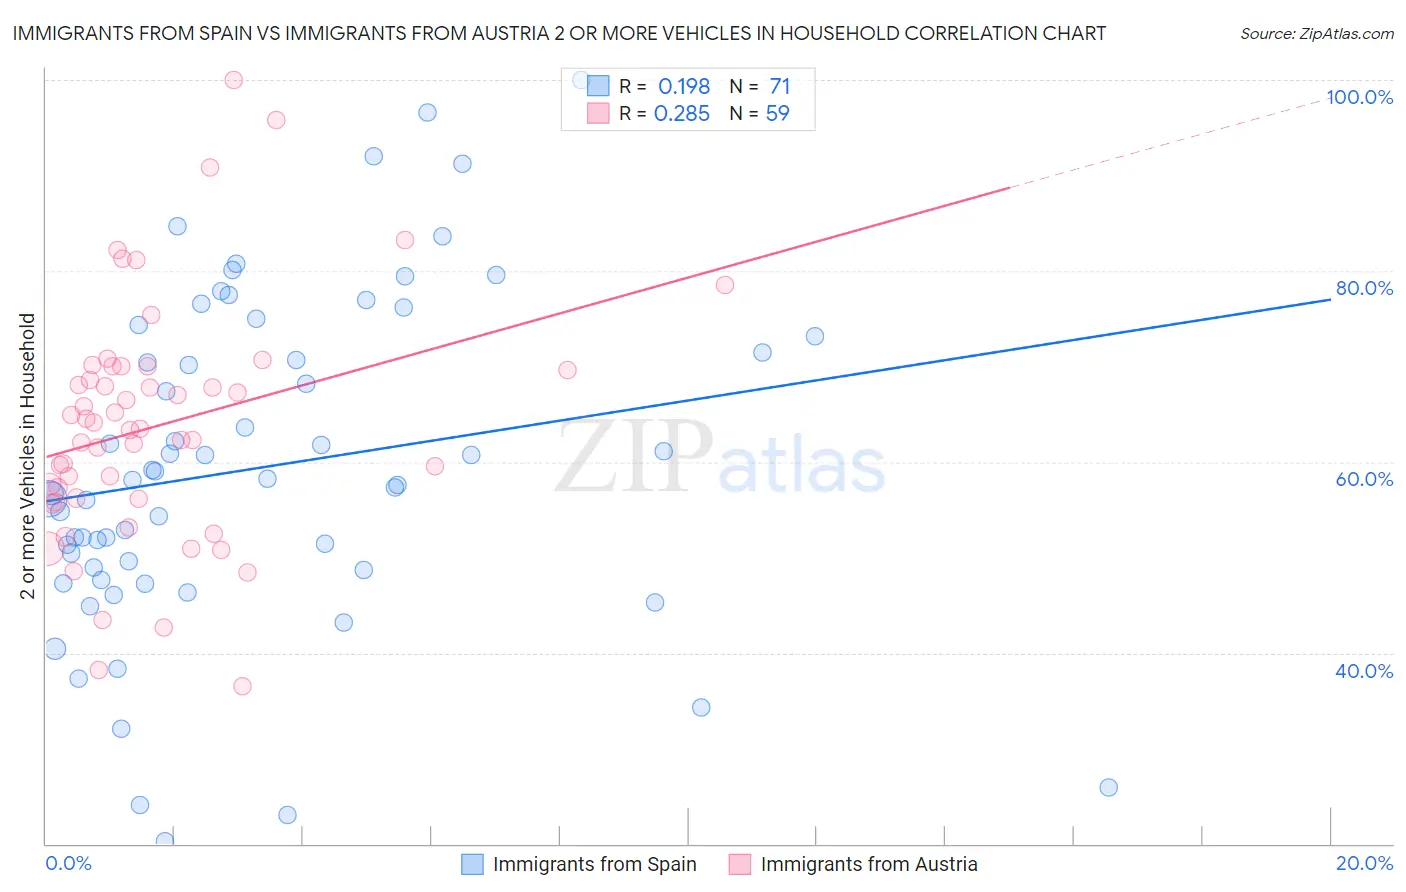
Immigrants from Spain vs Immigrants from Austria 2 or more Vehicles in Household Correlation Chart
The statistical analysis conducted on geographies consisting of 239,620,026 people shows a poor positive correlation between the proportion of Immigrants from Spain and percentage of households with 2 or more vehicles available in the United States with a correlation coefficient (R) of 0.198 and weighted average of 50.4%. Similarly, the statistical analysis conducted on geographies consisting of 167,963,508 people shows a weak positive correlation between the proportion of Immigrants from Austria and percentage of households with 2 or more vehicles available in the United States with a correlation coefficient (R) of 0.285 and weighted average of 55.5%, a difference of 10.1%.
2 or more Vehicles in Household Correlation Summary
| Measurement | Immigrants from Spain | Immigrants from Austria |
| Minimum | 20.3% | 36.4% |
| Maximum | 100.0% | 100.0% |
| Range | 79.7% | 63.6% |
| Mean | 59.4% | 63.8% |
| Median | 58.2% | 63.4% |
| Interquartile 25% (IQ1) | 48.7% | 56.1% |
| Interquartile 75% (IQ3) | 73.2% | 70.0% |
| Interquartile Range (IQR) | 24.6% | 13.9% |
| Standard Deviation (Sample) | 17.4% | 12.6% |
| Standard Deviation (Population) | 17.3% | 12.5% |
Similar Demographics by 2 or more Vehicles in Household
Demographics Similar to Immigrants from Spain by 2 or more Vehicles in Household
In terms of 2 or more vehicles in household, the demographic groups most similar to Immigrants from Spain are Paraguayan (50.3%, a difference of 0.13%), Immigrants from Morocco (50.3%, a difference of 0.16%), Immigrants from Russia (50.3%, a difference of 0.20%), Immigrants from Somalia (50.5%, a difference of 0.27%), and Cypriot (50.6%, a difference of 0.31%).
| Demographics | Rating | Rank | 2 or more Vehicles in Household |
| Immigrants | Panama | 0.0 /100 | #290 | Tragic 51.1% |
| Belizeans | 0.0 /100 | #291 | Tragic 51.0% |
| Immigrants | Ukraine | 0.0 /100 | #292 | Tragic 50.9% |
| Blacks/African Americans | 0.0 /100 | #293 | Tragic 50.9% |
| Bermudans | 0.0 /100 | #294 | Tragic 50.6% |
| Cypriots | 0.0 /100 | #295 | Tragic 50.6% |
| Immigrants | Somalia | 0.0 /100 | #296 | Tragic 50.5% |
| Immigrants | Spain | 0.0 /100 | #297 | Tragic 50.4% |
| Paraguayans | 0.0 /100 | #298 | Tragic 50.3% |
| Immigrants | Morocco | 0.0 /100 | #299 | Tragic 50.3% |
| Immigrants | Russia | 0.0 /100 | #300 | Tragic 50.3% |
| Immigrants | Greece | 0.0 /100 | #301 | Tragic 50.2% |
| Immigrants | South America | 0.0 /100 | #302 | Tragic 50.2% |
| Tohono O'odham | 0.0 /100 | #303 | Tragic 50.0% |
| Immigrants | Belize | 0.0 /100 | #304 | Tragic 49.9% |
Demographics Similar to Immigrants from Austria by 2 or more Vehicles in Household
In terms of 2 or more vehicles in household, the demographic groups most similar to Immigrants from Austria are French American Indian (55.5%, a difference of 0.010%), Romanian (55.5%, a difference of 0.020%), Kenyan (55.5%, a difference of 0.070%), Immigrants from Sri Lanka (55.5%, a difference of 0.080%), and Immigrants from Costa Rica (55.4%, a difference of 0.080%).
| Demographics | Rating | Rank | 2 or more Vehicles in Household |
| German Russians | 60.9 /100 | #162 | Good 55.6% |
| Immigrants | Zimbabwe | 60.2 /100 | #163 | Good 55.6% |
| Dutch West Indians | 59.8 /100 | #164 | Average 55.6% |
| Immigrants | El Salvador | 59.4 /100 | #165 | Average 55.6% |
| Immigrants | Sri Lanka | 58.3 /100 | #166 | Average 55.5% |
| Kenyans | 58.1 /100 | #167 | Average 55.5% |
| French American Indians | 56.7 /100 | #168 | Average 55.5% |
| Immigrants | Austria | 56.3 /100 | #169 | Average 55.5% |
| Romanians | 55.8 /100 | #170 | Average 55.5% |
| Immigrants | Costa Rica | 54.4 /100 | #171 | Average 55.4% |
| Immigrants | Nicaragua | 51.6 /100 | #172 | Average 55.4% |
| Immigrants | Western Europe | 51.4 /100 | #173 | Average 55.4% |
| Navajo | 50.0 /100 | #174 | Average 55.3% |
| Immigrants | Denmark | 49.4 /100 | #175 | Average 55.3% |
| Immigrants | Cuba | 47.0 /100 | #176 | Average 55.3% |