Immigrants from Spain vs Norwegian 2 or more Vehicles in Household
COMPARE
Immigrants from Spain
Norwegian
2 or more Vehicles in Household
2 or more Vehicles in Household Comparison
Immigrants from Spain
Norwegians
50.4%
2 OR MORE VEHICLES IN HOUSEHOLD
0.0/ 100
METRIC RATING
297th/ 347
METRIC RANK
62.8%
2 OR MORE VEHICLES IN HOUSEHOLD
100.0/ 100
METRIC RATING
4th/ 347
METRIC RANK
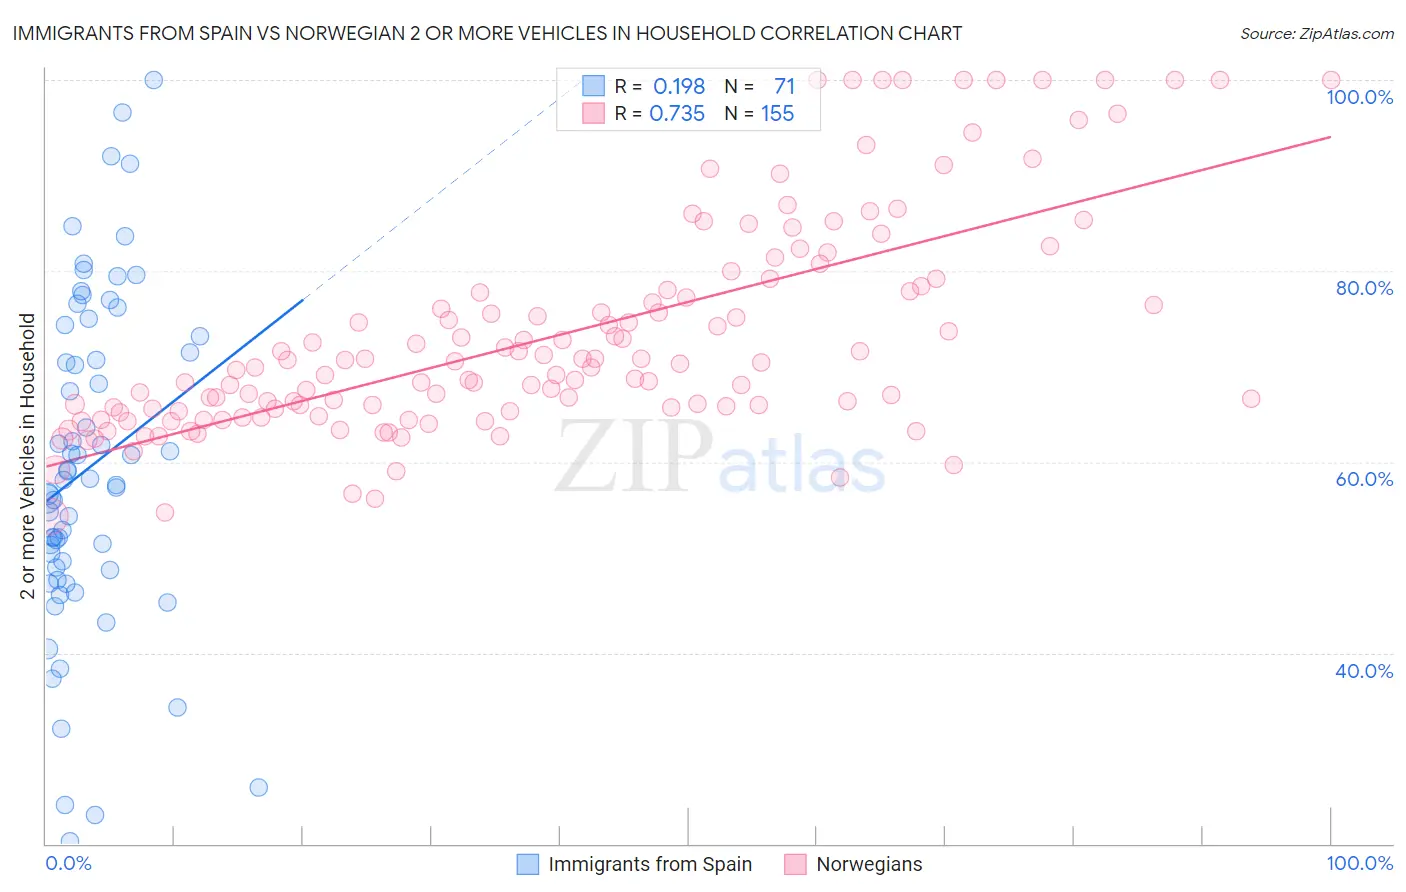
Immigrants from Spain vs Norwegian 2 or more Vehicles in Household Correlation Chart
The statistical analysis conducted on geographies consisting of 239,620,026 people shows a poor positive correlation between the proportion of Immigrants from Spain and percentage of households with 2 or more vehicles available in the United States with a correlation coefficient (R) of 0.198 and weighted average of 50.4%. Similarly, the statistical analysis conducted on geographies consisting of 532,963,980 people shows a strong positive correlation between the proportion of Norwegians and percentage of households with 2 or more vehicles available in the United States with a correlation coefficient (R) of 0.735 and weighted average of 62.8%, a difference of 24.7%.
2 or more Vehicles in Household Correlation Summary
| Measurement | Immigrants from Spain | Norwegian |
| Minimum | 20.3% | 54.4% |
| Maximum | 100.0% | 100.0% |
| Range | 79.7% | 45.6% |
| Mean | 59.4% | 73.2% |
| Median | 58.2% | 69.9% |
| Interquartile 25% (IQ1) | 48.7% | 65.3% |
| Interquartile 75% (IQ3) | 73.2% | 78.0% |
| Interquartile Range (IQR) | 24.6% | 12.7% |
| Standard Deviation (Sample) | 17.4% | 11.3% |
| Standard Deviation (Population) | 17.3% | 11.3% |
Similar Demographics by 2 or more Vehicles in Household
Demographics Similar to Immigrants from Spain by 2 or more Vehicles in Household
In terms of 2 or more vehicles in household, the demographic groups most similar to Immigrants from Spain are Paraguayan (50.3%, a difference of 0.13%), Immigrants from Morocco (50.3%, a difference of 0.16%), Immigrants from Russia (50.3%, a difference of 0.20%), Immigrants from Somalia (50.5%, a difference of 0.27%), and Cypriot (50.6%, a difference of 0.31%).
| Demographics | Rating | Rank | 2 or more Vehicles in Household |
| Immigrants | Panama | 0.0 /100 | #290 | Tragic 51.1% |
| Belizeans | 0.0 /100 | #291 | Tragic 51.0% |
| Immigrants | Ukraine | 0.0 /100 | #292 | Tragic 50.9% |
| Blacks/African Americans | 0.0 /100 | #293 | Tragic 50.9% |
| Bermudans | 0.0 /100 | #294 | Tragic 50.6% |
| Cypriots | 0.0 /100 | #295 | Tragic 50.6% |
| Immigrants | Somalia | 0.0 /100 | #296 | Tragic 50.5% |
| Immigrants | Spain | 0.0 /100 | #297 | Tragic 50.4% |
| Paraguayans | 0.0 /100 | #298 | Tragic 50.3% |
| Immigrants | Morocco | 0.0 /100 | #299 | Tragic 50.3% |
| Immigrants | Russia | 0.0 /100 | #300 | Tragic 50.3% |
| Immigrants | Greece | 0.0 /100 | #301 | Tragic 50.2% |
| Immigrants | South America | 0.0 /100 | #302 | Tragic 50.2% |
| Tohono O'odham | 0.0 /100 | #303 | Tragic 50.0% |
| Immigrants | Belize | 0.0 /100 | #304 | Tragic 49.9% |
Demographics Similar to Norwegians by 2 or more Vehicles in Household
In terms of 2 or more vehicles in household, the demographic groups most similar to Norwegians are Danish (63.3%, a difference of 0.69%), Immigrants from Fiji (62.3%, a difference of 0.87%), Tongan (63.5%, a difference of 1.1%), Scandinavian (62.1%, a difference of 1.2%), and Puget Sound Salish (62.1%, a difference of 1.3%).
| Demographics | Rating | Rank | 2 or more Vehicles in Household |
| Yakama | 100.0 /100 | #1 | Exceptional 64.9% |
| Tongans | 100.0 /100 | #2 | Exceptional 63.5% |
| Danes | 100.0 /100 | #3 | Exceptional 63.3% |
| Norwegians | 100.0 /100 | #4 | Exceptional 62.8% |
| Immigrants | Fiji | 100.0 /100 | #5 | Exceptional 62.3% |
| Scandinavians | 100.0 /100 | #6 | Exceptional 62.1% |
| Puget Sound Salish | 100.0 /100 | #7 | Exceptional 62.1% |
| English | 100.0 /100 | #8 | Exceptional 61.9% |
| Swedes | 100.0 /100 | #9 | Exceptional 61.8% |
| Mexicans | 100.0 /100 | #10 | Exceptional 61.7% |
| Dutch | 100.0 /100 | #11 | Exceptional 61.6% |
| Germans | 100.0 /100 | #12 | Exceptional 61.6% |
| Samoans | 100.0 /100 | #13 | Exceptional 61.5% |
| Czechs | 100.0 /100 | #14 | Exceptional 61.5% |
| Nepalese | 100.0 /100 | #15 | Exceptional 61.4% |