Immigrants from Sierra Leone Disability Age Under 5
COMPARE
Immigrants from Sierra Leone
Select to Compare
Disability Age Under 5
Immigrants from Sierra Leone Disability Age Under 5
1.3%
DISABILITY | AGE UNDER 5
36.5/ 100
METRIC RATING
193rd/ 347
METRIC RANK
Immigrants from Sierra Leone Disability Age Under 5 Correlation Chart
The statistical analysis conducted on geographies consisting of 77,055,630 people shows a mild positive correlation between the proportion of Immigrants from Sierra Leone and percentage of population with a disability under the age of 5 in the United States with a correlation coefficient (R) of 0.388 and weighted average of 1.3%. On average, for every 1% (one percent) increase in Immigrants from Sierra Leone within a typical geography, there is an increase of 0.97% in percentage of population with a disability under the age of 5.
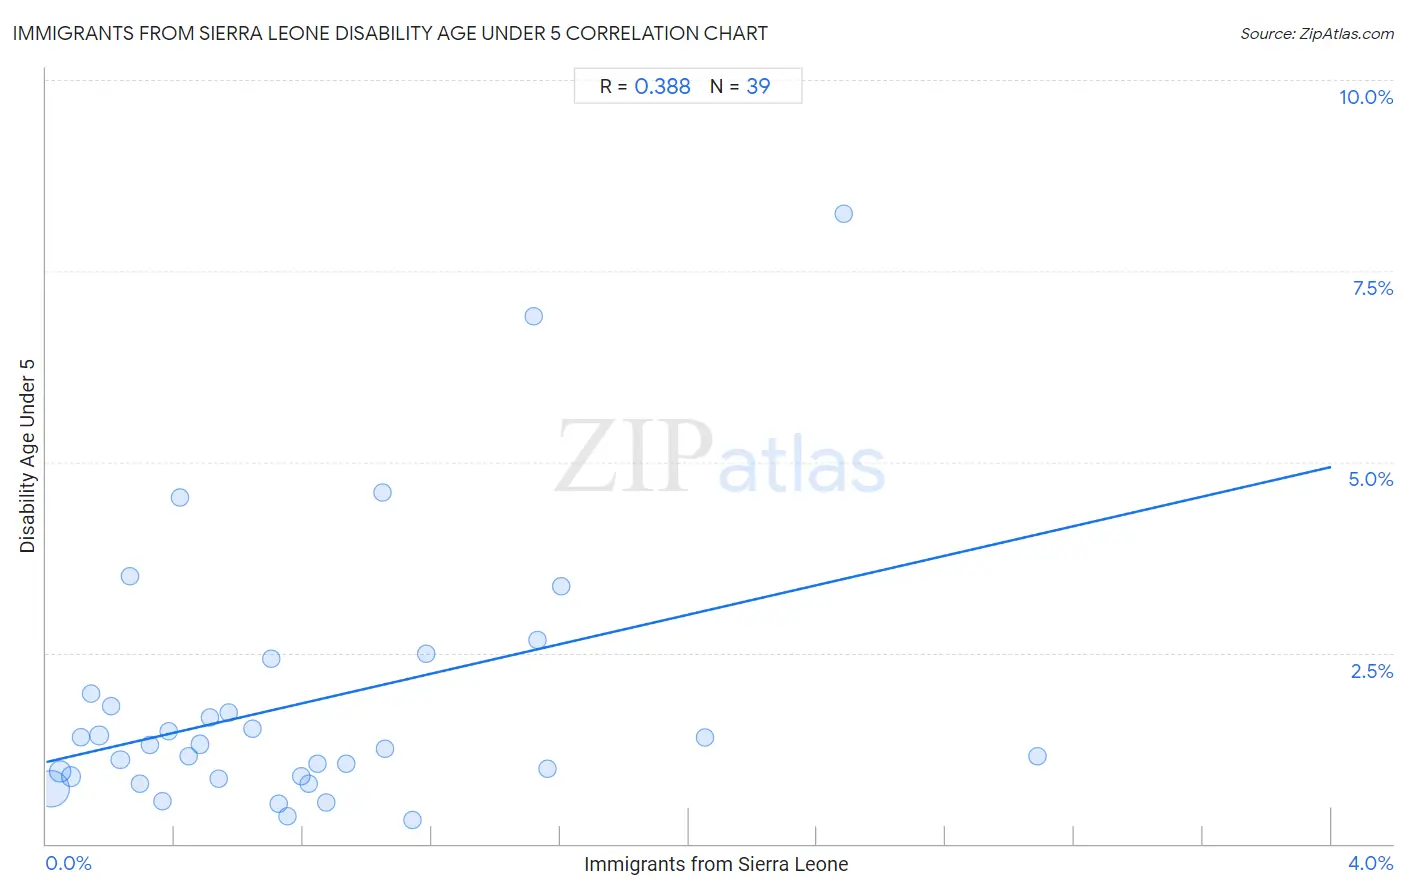
It is essential to understand that the correlation between the percentage of Immigrants from Sierra Leone and percentage of population with a disability under the age of 5 does not imply a direct cause-and-effect relationship. It remains uncertain whether the presence of Immigrants from Sierra Leone influences an upward or downward trend in the level of percentage of population with a disability under the age of 5 within an area, or if Immigrants from Sierra Leone simply ended up residing in those areas with higher or lower levels of percentage of population with a disability under the age of 5 due to other factors.
Demographics Similar to Immigrants from Sierra Leone by Disability Age Under 5
In terms of disability age under 5, the demographic groups most similar to Immigrants from Sierra Leone are Mexican American Indian (1.3%, a difference of 0.0%), Immigrants from Bosnia and Herzegovina (1.3%, a difference of 0.0%), Immigrants from Laos (1.3%, a difference of 0.010%), Peruvian (1.3%, a difference of 0.11%), and Immigrants from North Macedonia (1.3%, a difference of 0.18%).
| Demographics | Rating | Rank | Disability Age Under 5 |
| Cubans | 42.5 /100 | #186 | Average 1.2% |
| Immigrants from Haiti | 40.2 /100 | #187 | Average 1.3% |
| Haitians | 39.9 /100 | #188 | Fair 1.3% |
| Peruvians | 37.6 /100 | #189 | Fair 1.3% |
| Immigrants from Laos | 36.6 /100 | #190 | Fair 1.3% |
| Mexican American Indians | 36.6 /100 | #191 | Fair 1.3% |
| Immigrants from Bosnia and Herzegovina | 36.5 /100 | #192 | Fair 1.3% |
| Immigrants from Sierra Leone | 36.5 /100 | #193 | Fair 1.3% |
| Immigrants from North Macedonia | 34.7 /100 | #194 | Fair 1.3% |
| U.S. Virgin Islanders | 34.4 /100 | #195 | Fair 1.3% |
| Immigrants from Belgium | 31.4 /100 | #196 | Fair 1.3% |
| Immigrants from Somalia | 31.3 /100 | #197 | Fair 1.3% |
| Immigrants from Norway | 31.1 /100 | #198 | Fair 1.3% |
| Jamaicans | 30.7 /100 | #199 | Fair 1.3% |
| Immigrants from Lithuania | 27.2 /100 | #200 | Fair 1.3% |
Immigrants from Sierra Leone Disability Age Under 5 Correlation Summary
| Measurement | Immigrants from Sierra Leone Data | Disability Age Under 5 Data |
| Minimum | 0.014% | 0.31% |
| Maximum | 3.1% | 8.2% |
| Range | 3.1% | 7.9% |
| Mean | 0.79% | 1.8% |
| Median | 0.64% | 1.3% |
| Interquartile 25% (IQ1) | 0.29% | 0.88% |
| Interquartile 75% (IQ3) | 1.1% | 2.0% |
| Interquartile Range (IQR) | 0.77% | 1.1% |
| Standard Deviation (Sample) | 0.68% | 1.7% |
| Standard Deviation (Population) | 0.68% | 1.7% |
Correlation Details
| Immigrants from Sierra Leone Percentile | Sample Size | Disability Age Under 5 |
[ 0.0% - 0.5% ] 0.014% | 53,189,472 | 0.72% |
[ 0.0% - 0.5% ] 0.044% | 9,790,733 | 0.94% |
[ 0.0% - 0.5% ] 0.077% | 4,958,023 | 0.88% |
[ 0.0% - 0.5% ] 0.11% | 1,521,645 | 1.4% |
[ 0.0% - 0.5% ] 0.14% | 884,746 | 2.0% |
[ 0.0% - 0.5% ] 0.16% | 1,142,518 | 1.4% |
[ 0.0% - 0.5% ] 0.20% | 684,207 | 1.8% |
[ 0.0% - 0.5% ] 0.23% | 1,551,937 | 1.1% |
[ 0.0% - 0.5% ] 0.26% | 115,058 | 3.5% |
[ 0.0% - 0.5% ] 0.29% | 252,221 | 0.79% |
[ 0.0% - 0.5% ] 0.32% | 481,755 | 1.3% |
[ 0.0% - 0.5% ] 0.36% | 197,389 | 0.56% |
[ 0.0% - 0.5% ] 0.38% | 196,589 | 1.5% |
[ 0.0% - 0.5% ] 0.42% | 36,627 | 4.5% |
[ 0.0% - 0.5% ] 0.44% | 216,290 | 1.1% |
[ 0.0% - 0.5% ] 0.48% | 255,760 | 1.3% |
[ 0.5% - 1.0% ] 0.51% | 223,147 | 1.7% |
[ 0.5% - 1.0% ] 0.54% | 280,777 | 0.86% |
[ 0.5% - 1.0% ] 0.57% | 128,386 | 1.7% |
[ 0.5% - 1.0% ] 0.64% | 83,654 | 1.5% |
[ 0.5% - 1.0% ] 0.70% | 60,373 | 2.4% |
[ 0.5% - 1.0% ] 0.72% | 83,796 | 0.53% |
[ 0.5% - 1.0% ] 0.75% | 60,693 | 0.36% |
[ 0.5% - 1.0% ] 0.79% | 42,847 | 0.89% |
[ 0.5% - 1.0% ] 0.82% | 176,358 | 0.79% |
[ 0.5% - 1.0% ] 0.85% | 41,281 | 1.1% |
[ 0.5% - 1.0% ] 0.87% | 71,560 | 0.53% |
[ 0.5% - 1.0% ] 0.93% | 23,141 | 1.0% |
[ 1.0% - 1.5% ] 1.05% | 27,683 | 4.6% |
[ 1.0% - 1.5% ] 1.06% | 11,455 | 1.3% |
[ 1.0% - 1.5% ] 1.14% | 27,761 | 0.31% |
[ 1.0% - 1.5% ] 1.18% | 79,834 | 2.5% |
[ 1.5% - 2.0% ] 1.52% | 6,132 | 6.9% |
[ 1.5% - 2.0% ] 1.53% | 28,905 | 2.7% |
[ 1.5% - 2.0% ] 1.56% | 28,660 | 0.98% |
[ 1.5% - 2.0% ] 1.60% | 45,799 | 3.4% |
[ 2.0% - 2.5% ] 2.05% | 19,704 | 1.4% |
[ 2.0% - 2.5% ] 2.48% | 9,183 | 8.2% |
[ 3.0% - 3.5% ] 3.09% | 19,531 | 1.2% |