Immigrants from Sierra Leone vs Immigrants from Uganda 2 or more Vehicles in Household
COMPARE
Immigrants from Sierra Leone
Immigrants from Uganda
2 or more Vehicles in Household
2 or more Vehicles in Household Comparison
Immigrants from Sierra Leone
Immigrants from Uganda
53.2%
2 OR MORE VEHICLES IN HOUSEHOLD
2.1/ 100
METRIC RATING
241st/ 347
METRIC RANK
55.0%
2 OR MORE VEHICLES IN HOUSEHOLD
33.4/ 100
METRIC RATING
187th/ 347
METRIC RANK
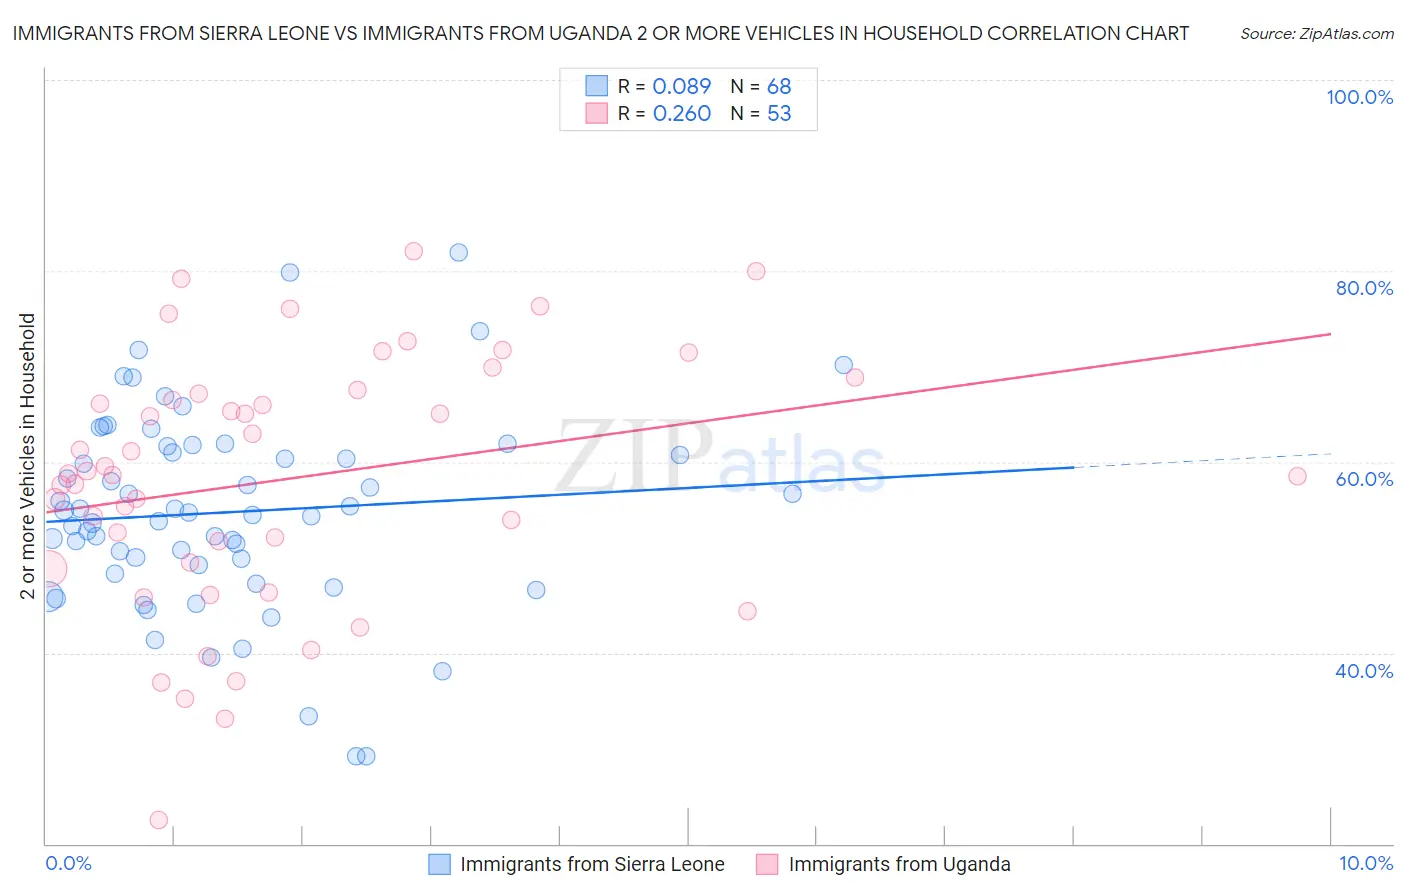
Immigrants from Sierra Leone vs Immigrants from Uganda 2 or more Vehicles in Household Correlation Chart
The statistical analysis conducted on geographies consisting of 101,647,201 people shows a slight positive correlation between the proportion of Immigrants from Sierra Leone and percentage of households with 2 or more vehicles available in the United States with a correlation coefficient (R) of 0.089 and weighted average of 53.2%. Similarly, the statistical analysis conducted on geographies consisting of 125,974,533 people shows a weak positive correlation between the proportion of Immigrants from Uganda and percentage of households with 2 or more vehicles available in the United States with a correlation coefficient (R) of 0.260 and weighted average of 55.0%, a difference of 3.3%.
2 or more Vehicles in Household Correlation Summary
| Measurement | Immigrants from Sierra Leone | Immigrants from Uganda |
| Minimum | 29.1% | 22.5% |
| Maximum | 81.9% | 82.0% |
| Range | 52.8% | 59.5% |
| Mean | 54.7% | 58.2% |
| Median | 54.6% | 58.8% |
| Interquartile 25% (IQ1) | 48.7% | 49.1% |
| Interquartile 75% (IQ3) | 61.3% | 67.3% |
| Interquartile Range (IQR) | 12.6% | 18.2% |
| Standard Deviation (Sample) | 10.4% | 13.3% |
| Standard Deviation (Population) | 10.3% | 13.2% |
Similar Demographics by 2 or more Vehicles in Household
Demographics Similar to Immigrants from Sierra Leone by 2 or more Vehicles in Household
In terms of 2 or more vehicles in household, the demographic groups most similar to Immigrants from Sierra Leone are Immigrants from Eastern Asia (53.2%, a difference of 0.0%), Immigrants from Europe (53.2%, a difference of 0.030%), Immigrants from Armenia (53.3%, a difference of 0.10%), Cambodian (53.3%, a difference of 0.10%), and Macedonian (53.3%, a difference of 0.17%).
| Demographics | Rating | Rank | 2 or more Vehicles in Household |
| Immigrants | Switzerland | 3.0 /100 | #234 | Tragic 53.4% |
| Immigrants | Middle Africa | 3.0 /100 | #235 | Tragic 53.4% |
| Indonesians | 2.7 /100 | #236 | Tragic 53.4% |
| Macedonians | 2.4 /100 | #237 | Tragic 53.3% |
| Immigrants | Armenia | 2.3 /100 | #238 | Tragic 53.3% |
| Cambodians | 2.3 /100 | #239 | Tragic 53.3% |
| Immigrants | Europe | 2.1 /100 | #240 | Tragic 53.2% |
| Immigrants | Sierra Leone | 2.1 /100 | #241 | Tragic 53.2% |
| Immigrants | Eastern Asia | 2.1 /100 | #242 | Tragic 53.2% |
| Ethiopians | 1.7 /100 | #243 | Tragic 53.1% |
| Indians (Asian) | 1.7 /100 | #244 | Tragic 53.1% |
| Immigrants | Ethiopia | 1.5 /100 | #245 | Tragic 53.0% |
| Immigrants | Nigeria | 1.2 /100 | #246 | Tragic 52.9% |
| Sierra Leoneans | 1.2 /100 | #247 | Tragic 52.9% |
| Colombians | 1.1 /100 | #248 | Tragic 52.9% |
Demographics Similar to Immigrants from Uganda by 2 or more Vehicles in Household
In terms of 2 or more vehicles in household, the demographic groups most similar to Immigrants from Uganda are Peruvian (55.0%, a difference of 0.010%), Arab (55.0%, a difference of 0.11%), Marshallese (54.9%, a difference of 0.13%), Apache (55.1%, a difference of 0.15%), and Immigrants from Cameroon (55.1%, a difference of 0.17%).
| Demographics | Rating | Rank | 2 or more Vehicles in Household |
| Immigrants | Kenya | 40.4 /100 | #180 | Average 55.1% |
| Immigrants | Micronesia | 38.2 /100 | #181 | Fair 55.1% |
| Cree | 38.2 /100 | #182 | Fair 55.1% |
| Immigrants | Cameroon | 37.3 /100 | #183 | Fair 55.1% |
| Apache | 36.7 /100 | #184 | Fair 55.1% |
| Arabs | 35.9 /100 | #185 | Fair 55.0% |
| Peruvians | 33.7 /100 | #186 | Fair 55.0% |
| Immigrants | Uganda | 33.4 /100 | #187 | Fair 55.0% |
| Marshallese | 30.5 /100 | #188 | Fair 54.9% |
| Eastern Europeans | 27.5 /100 | #189 | Fair 54.8% |
| Russians | 26.3 /100 | #190 | Fair 54.8% |
| Immigrants | Immigrants | 25.0 /100 | #191 | Fair 54.7% |
| Immigrants | Romania | 23.8 /100 | #192 | Fair 54.7% |
| Immigrants | Japan | 23.4 /100 | #193 | Fair 54.7% |
| Central Americans | 23.0 /100 | #194 | Fair 54.7% |