Immigrants from Sierra Leone vs Ghanaian 2 or more Vehicles in Household
COMPARE
Immigrants from Sierra Leone
Ghanaian
2 or more Vehicles in Household
2 or more Vehicles in Household Comparison
Immigrants from Sierra Leone
Ghanaians
53.2%
2 OR MORE VEHICLES IN HOUSEHOLD
2.1/ 100
METRIC RATING
241st/ 347
METRIC RANK
48.0%
2 OR MORE VEHICLES IN HOUSEHOLD
0.0/ 100
METRIC RATING
310th/ 347
METRIC RANK
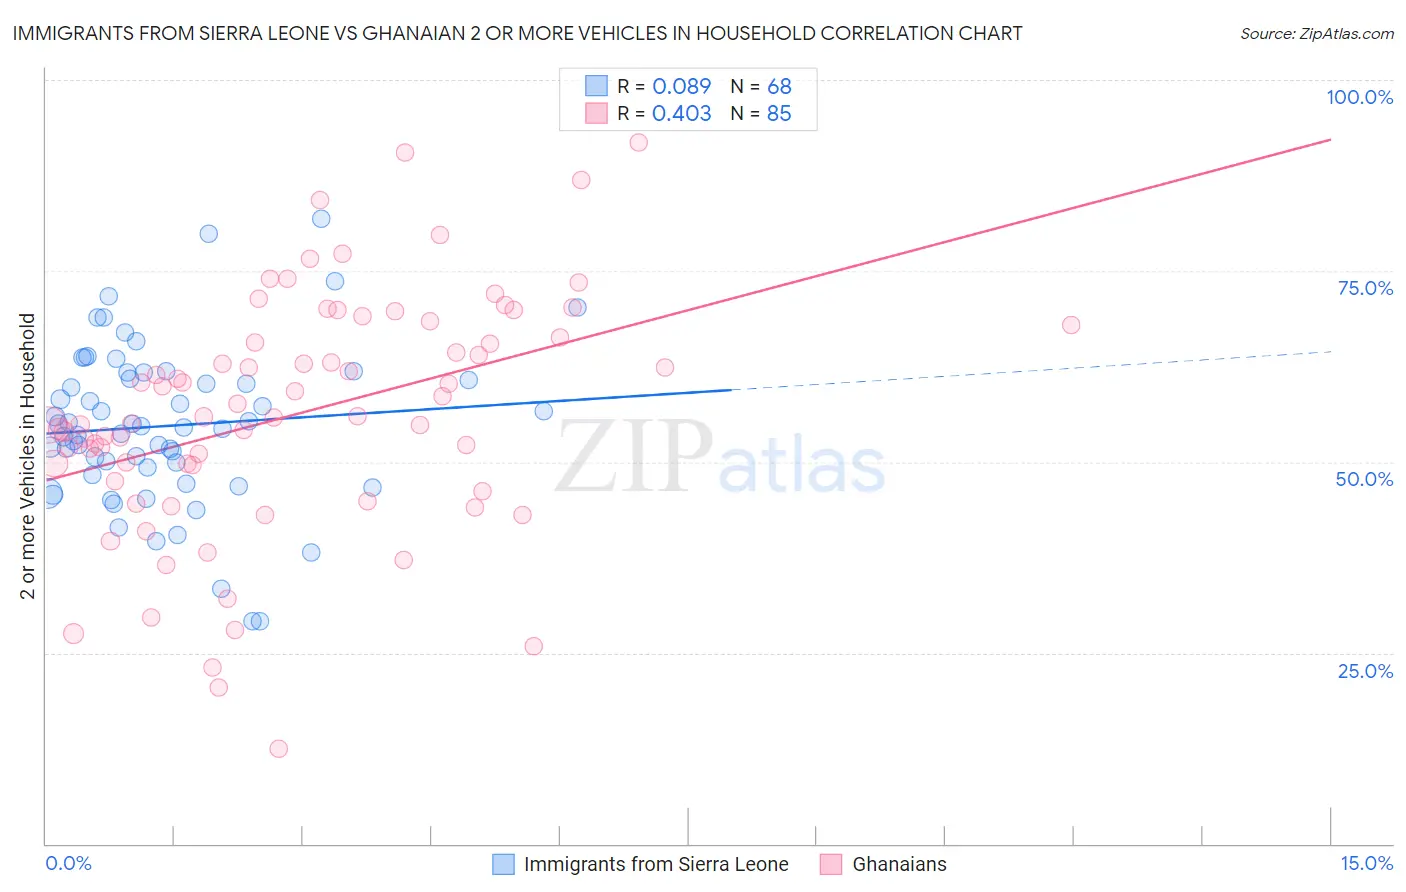
Immigrants from Sierra Leone vs Ghanaian 2 or more Vehicles in Household Correlation Chart
The statistical analysis conducted on geographies consisting of 101,647,201 people shows a slight positive correlation between the proportion of Immigrants from Sierra Leone and percentage of households with 2 or more vehicles available in the United States with a correlation coefficient (R) of 0.089 and weighted average of 53.2%. Similarly, the statistical analysis conducted on geographies consisting of 190,548,121 people shows a moderate positive correlation between the proportion of Ghanaians and percentage of households with 2 or more vehicles available in the United States with a correlation coefficient (R) of 0.403 and weighted average of 48.0%, a difference of 11.0%.
2 or more Vehicles in Household Correlation Summary
| Measurement | Immigrants from Sierra Leone | Ghanaian |
| Minimum | 29.1% | 12.4% |
| Maximum | 81.9% | 91.9% |
| Range | 52.8% | 79.5% |
| Mean | 54.7% | 56.3% |
| Median | 54.6% | 55.9% |
| Interquartile 25% (IQ1) | 48.7% | 48.5% |
| Interquartile 75% (IQ3) | 61.3% | 67.2% |
| Interquartile Range (IQR) | 12.6% | 18.7% |
| Standard Deviation (Sample) | 10.4% | 15.6% |
| Standard Deviation (Population) | 10.3% | 15.5% |
Similar Demographics by 2 or more Vehicles in Household
Demographics Similar to Immigrants from Sierra Leone by 2 or more Vehicles in Household
In terms of 2 or more vehicles in household, the demographic groups most similar to Immigrants from Sierra Leone are Immigrants from Eastern Asia (53.2%, a difference of 0.0%), Immigrants from Europe (53.2%, a difference of 0.030%), Immigrants from Armenia (53.3%, a difference of 0.10%), Cambodian (53.3%, a difference of 0.10%), and Macedonian (53.3%, a difference of 0.17%).
| Demographics | Rating | Rank | 2 or more Vehicles in Household |
| Immigrants | Switzerland | 3.0 /100 | #234 | Tragic 53.4% |
| Immigrants | Middle Africa | 3.0 /100 | #235 | Tragic 53.4% |
| Indonesians | 2.7 /100 | #236 | Tragic 53.4% |
| Macedonians | 2.4 /100 | #237 | Tragic 53.3% |
| Immigrants | Armenia | 2.3 /100 | #238 | Tragic 53.3% |
| Cambodians | 2.3 /100 | #239 | Tragic 53.3% |
| Immigrants | Europe | 2.1 /100 | #240 | Tragic 53.2% |
| Immigrants | Sierra Leone | 2.1 /100 | #241 | Tragic 53.2% |
| Immigrants | Eastern Asia | 2.1 /100 | #242 | Tragic 53.2% |
| Ethiopians | 1.7 /100 | #243 | Tragic 53.1% |
| Indians (Asian) | 1.7 /100 | #244 | Tragic 53.1% |
| Immigrants | Ethiopia | 1.5 /100 | #245 | Tragic 53.0% |
| Immigrants | Nigeria | 1.2 /100 | #246 | Tragic 52.9% |
| Sierra Leoneans | 1.2 /100 | #247 | Tragic 52.9% |
| Colombians | 1.1 /100 | #248 | Tragic 52.9% |
Demographics Similar to Ghanaians by 2 or more Vehicles in Household
In terms of 2 or more vehicles in household, the demographic groups most similar to Ghanaians are Immigrants from Belarus (47.9%, a difference of 0.12%), Haitian (47.6%, a difference of 0.86%), U.S. Virgin Islander (47.5%, a difference of 1.0%), Immigrants from Ghana (47.4%, a difference of 1.3%), and Moroccan (48.8%, a difference of 1.8%).
| Demographics | Rating | Rank | 2 or more Vehicles in Household |
| Tohono O'odham | 0.0 /100 | #303 | Tragic 50.0% |
| Immigrants | Belize | 0.0 /100 | #304 | Tragic 49.9% |
| Immigrants | Western Africa | 0.0 /100 | #305 | Tragic 49.4% |
| Immigrants | Israel | 0.0 /100 | #306 | Tragic 49.2% |
| Hopi | 0.0 /100 | #307 | Tragic 49.0% |
| Albanians | 0.0 /100 | #308 | Tragic 49.0% |
| Moroccans | 0.0 /100 | #309 | Tragic 48.8% |
| Ghanaians | 0.0 /100 | #310 | Tragic 48.0% |
| Immigrants | Belarus | 0.0 /100 | #311 | Tragic 47.9% |
| Haitians | 0.0 /100 | #312 | Tragic 47.6% |
| U.S. Virgin Islanders | 0.0 /100 | #313 | Tragic 47.5% |
| Immigrants | Ghana | 0.0 /100 | #314 | Tragic 47.4% |
| Puerto Ricans | 0.0 /100 | #315 | Tragic 47.1% |
| Cape Verdeans | 0.0 /100 | #316 | Tragic 46.8% |
| Immigrants | Haiti | 0.0 /100 | #317 | Tragic 46.5% |