Immigrants from Sierra Leone vs Immigrants from South Central Asia 2 or more Vehicles in Household
COMPARE
Immigrants from Sierra Leone
Immigrants from South Central Asia
2 or more Vehicles in Household
2 or more Vehicles in Household Comparison
Immigrants from Sierra Leone
Immigrants from South Central Asia
53.2%
2 OR MORE VEHICLES IN HOUSEHOLD
2.1/ 100
METRIC RATING
241st/ 347
METRIC RANK
56.6%
2 OR MORE VEHICLES IN HOUSEHOLD
90.5/ 100
METRIC RATING
128th/ 347
METRIC RANK
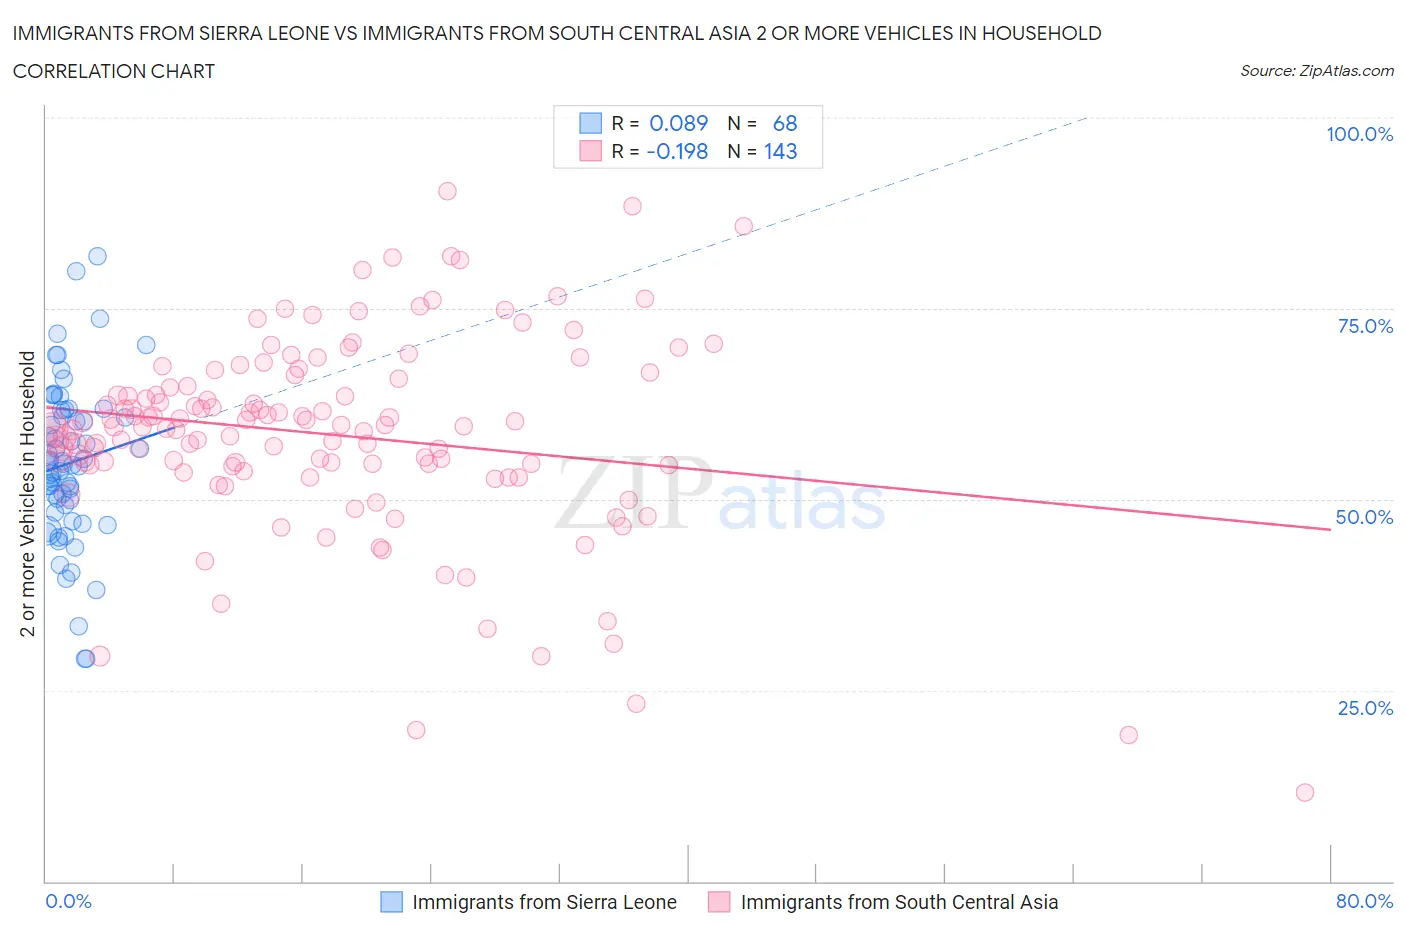
Immigrants from Sierra Leone vs Immigrants from South Central Asia 2 or more Vehicles in Household Correlation Chart
The statistical analysis conducted on geographies consisting of 101,647,201 people shows a slight positive correlation between the proportion of Immigrants from Sierra Leone and percentage of households with 2 or more vehicles available in the United States with a correlation coefficient (R) of 0.089 and weighted average of 53.2%. Similarly, the statistical analysis conducted on geographies consisting of 472,708,525 people shows a poor negative correlation between the proportion of Immigrants from South Central Asia and percentage of households with 2 or more vehicles available in the United States with a correlation coefficient (R) of -0.198 and weighted average of 56.6%, a difference of 6.3%.
2 or more Vehicles in Household Correlation Summary
| Measurement | Immigrants from Sierra Leone | Immigrants from South Central Asia |
| Minimum | 29.1% | 11.6% |
| Maximum | 81.9% | 90.3% |
| Range | 52.8% | 78.7% |
| Mean | 54.7% | 58.5% |
| Median | 54.6% | 59.5% |
| Interquartile 25% (IQ1) | 48.7% | 54.4% |
| Interquartile 75% (IQ3) | 61.3% | 64.8% |
| Interquartile Range (IQR) | 12.6% | 10.4% |
| Standard Deviation (Sample) | 10.4% | 12.9% |
| Standard Deviation (Population) | 10.3% | 12.9% |
Similar Demographics by 2 or more Vehicles in Household
Demographics Similar to Immigrants from Sierra Leone by 2 or more Vehicles in Household
In terms of 2 or more vehicles in household, the demographic groups most similar to Immigrants from Sierra Leone are Immigrants from Eastern Asia (53.2%, a difference of 0.0%), Immigrants from Europe (53.2%, a difference of 0.030%), Immigrants from Armenia (53.3%, a difference of 0.10%), Cambodian (53.3%, a difference of 0.10%), and Macedonian (53.3%, a difference of 0.17%).
| Demographics | Rating | Rank | 2 or more Vehicles in Household |
| Immigrants | Switzerland | 3.0 /100 | #234 | Tragic 53.4% |
| Immigrants | Middle Africa | 3.0 /100 | #235 | Tragic 53.4% |
| Indonesians | 2.7 /100 | #236 | Tragic 53.4% |
| Macedonians | 2.4 /100 | #237 | Tragic 53.3% |
| Immigrants | Armenia | 2.3 /100 | #238 | Tragic 53.3% |
| Cambodians | 2.3 /100 | #239 | Tragic 53.3% |
| Immigrants | Europe | 2.1 /100 | #240 | Tragic 53.2% |
| Immigrants | Sierra Leone | 2.1 /100 | #241 | Tragic 53.2% |
| Immigrants | Eastern Asia | 2.1 /100 | #242 | Tragic 53.2% |
| Ethiopians | 1.7 /100 | #243 | Tragic 53.1% |
| Indians (Asian) | 1.7 /100 | #244 | Tragic 53.1% |
| Immigrants | Ethiopia | 1.5 /100 | #245 | Tragic 53.0% |
| Immigrants | Nigeria | 1.2 /100 | #246 | Tragic 52.9% |
| Sierra Leoneans | 1.2 /100 | #247 | Tragic 52.9% |
| Colombians | 1.1 /100 | #248 | Tragic 52.9% |
Demographics Similar to Immigrants from South Central Asia by 2 or more Vehicles in Household
In terms of 2 or more vehicles in household, the demographic groups most similar to Immigrants from South Central Asia are Immigrants from Thailand (56.6%, a difference of 0.020%), Ute (56.6%, a difference of 0.020%), Estonian (56.6%, a difference of 0.050%), Yugoslavian (56.6%, a difference of 0.060%), and Bulgarian (56.5%, a difference of 0.080%).
| Demographics | Rating | Rank | 2 or more Vehicles in Household |
| Sioux | 93.8 /100 | #121 | Exceptional 56.8% |
| Immigrants | South Africa | 92.5 /100 | #122 | Exceptional 56.7% |
| Australians | 91.8 /100 | #123 | Exceptional 56.7% |
| New Zealanders | 91.8 /100 | #124 | Exceptional 56.7% |
| Tsimshian | 91.6 /100 | #125 | Exceptional 56.7% |
| Estonians | 90.9 /100 | #126 | Exceptional 56.6% |
| Immigrants | Thailand | 90.7 /100 | #127 | Exceptional 56.6% |
| Immigrants | South Central Asia | 90.5 /100 | #128 | Exceptional 56.6% |
| Ute | 90.4 /100 | #129 | Exceptional 56.6% |
| Yugoslavians | 90.0 /100 | #130 | Exceptional 56.6% |
| Bulgarians | 89.7 /100 | #131 | Excellent 56.5% |
| Hungarians | 89.1 /100 | #132 | Excellent 56.5% |
| Comanche | 88.4 /100 | #133 | Excellent 56.5% |
| Immigrants | Azores | 86.6 /100 | #134 | Excellent 56.4% |
| Blackfeet | 86.5 /100 | #135 | Excellent 56.4% |