Immigrants from India vs Crow 2 or more Vehicles in Household
COMPARE
Immigrants from India
Crow
2 or more Vehicles in Household
2 or more Vehicles in Household Comparison
Immigrants from India
Crow
59.3%
2 OR MORE VEHICLES IN HOUSEHOLD
99.9/ 100
METRIC RATING
48th/ 347
METRIC RANK
55.7%
2 OR MORE VEHICLES IN HOUSEHOLD
67.0/ 100
METRIC RATING
160th/ 347
METRIC RANK
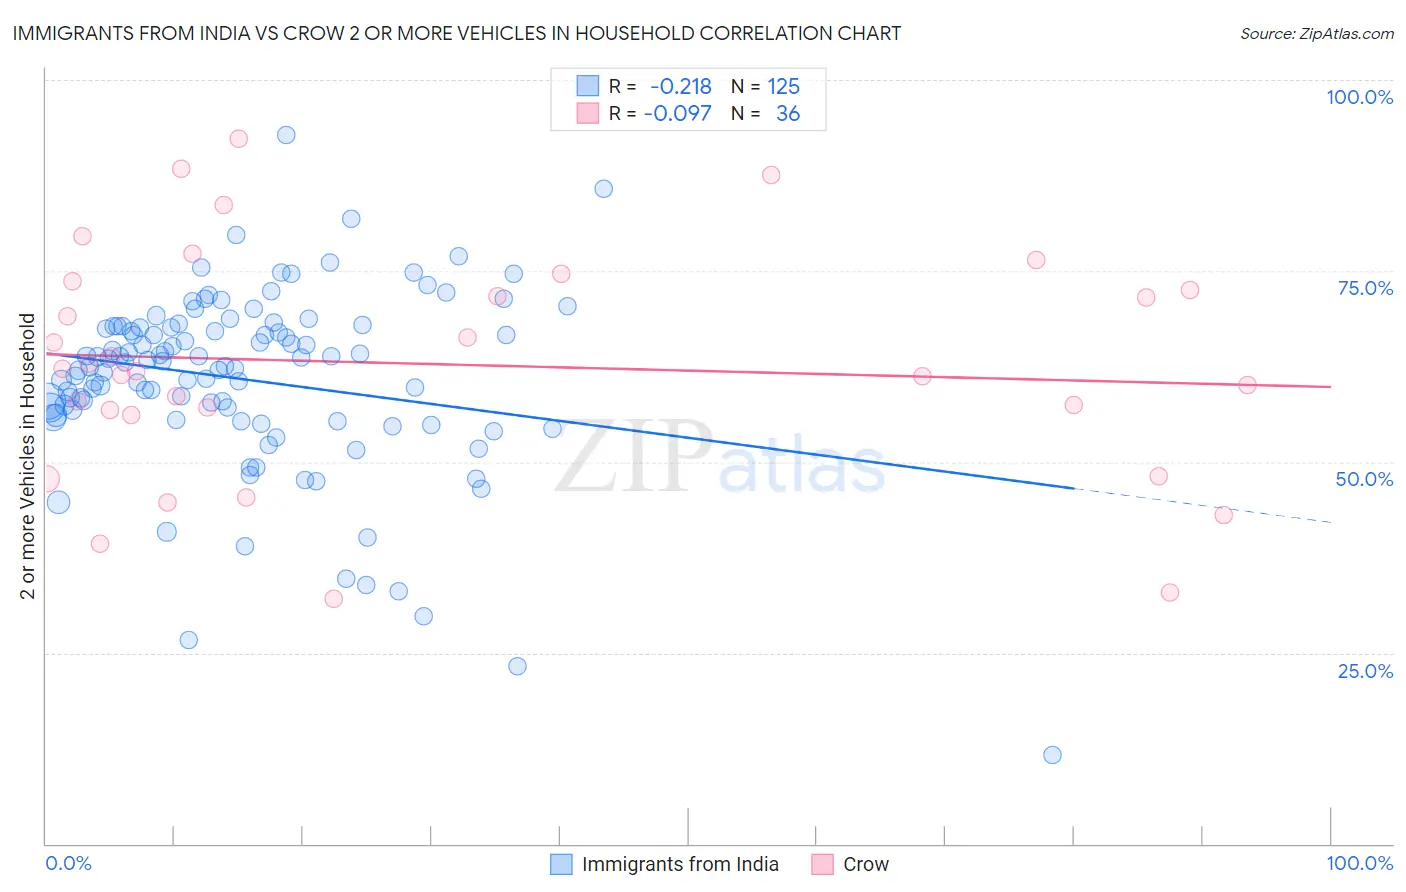
Immigrants from India vs Crow 2 or more Vehicles in Household Correlation Chart
The statistical analysis conducted on geographies consisting of 433,787,530 people shows a weak negative correlation between the proportion of Immigrants from India and percentage of households with 2 or more vehicles available in the United States with a correlation coefficient (R) of -0.218 and weighted average of 59.3%. Similarly, the statistical analysis conducted on geographies consisting of 59,203,156 people shows a slight negative correlation between the proportion of Crow and percentage of households with 2 or more vehicles available in the United States with a correlation coefficient (R) of -0.097 and weighted average of 55.7%, a difference of 6.4%.
2 or more Vehicles in Household Correlation Summary
| Measurement | Immigrants from India | Crow |
| Minimum | 11.6% | 32.0% |
| Maximum | 92.9% | 92.3% |
| Range | 81.2% | 60.3% |
| Mean | 60.8% | 62.8% |
| Median | 63.0% | 62.0% |
| Interquartile 25% (IQ1) | 55.9% | 56.5% |
| Interquartile 75% (IQ3) | 67.7% | 73.1% |
| Interquartile Range (IQR) | 11.7% | 16.6% |
| Standard Deviation (Sample) | 12.0% | 15.0% |
| Standard Deviation (Population) | 12.0% | 14.8% |
Similar Demographics by 2 or more Vehicles in Household
Demographics Similar to Immigrants from India by 2 or more Vehicles in Household
In terms of 2 or more vehicles in household, the demographic groups most similar to Immigrants from India are Yaqui (59.3%, a difference of 0.020%), Belgian (59.3%, a difference of 0.040%), Choctaw (59.3%, a difference of 0.040%), Spaniard (59.2%, a difference of 0.18%), and Immigrants from Laos (59.2%, a difference of 0.19%).
| Demographics | Rating | Rank | 2 or more Vehicles in Household |
| Northern Europeans | 100.0 /100 | #41 | Exceptional 59.9% |
| Malaysians | 100.0 /100 | #42 | Exceptional 59.8% |
| Czechoslovakians | 100.0 /100 | #43 | Exceptional 59.8% |
| French | 100.0 /100 | #44 | Exceptional 59.8% |
| Immigrants | Taiwan | 100.0 /100 | #45 | Exceptional 59.7% |
| Immigrants | South Eastern Asia | 100.0 /100 | #46 | Exceptional 59.6% |
| Yaqui | 99.9 /100 | #47 | Exceptional 59.3% |
| Immigrants | India | 99.9 /100 | #48 | Exceptional 59.3% |
| Belgians | 99.9 /100 | #49 | Exceptional 59.3% |
| Choctaw | 99.9 /100 | #50 | Exceptional 59.3% |
| Spaniards | 99.9 /100 | #51 | Exceptional 59.2% |
| Immigrants | Laos | 99.9 /100 | #52 | Exceptional 59.2% |
| Celtics | 99.9 /100 | #53 | Exceptional 59.2% |
| Bhutanese | 99.9 /100 | #54 | Exceptional 59.1% |
| Luxembourgers | 99.9 /100 | #55 | Exceptional 59.1% |
Demographics Similar to Crow by 2 or more Vehicles in Household
In terms of 2 or more vehicles in household, the demographic groups most similar to Crow are Paiute (55.8%, a difference of 0.050%), Tlingit-Haida (55.8%, a difference of 0.070%), Immigrants from Kuwait (55.8%, a difference of 0.14%), Immigrants from Lithuania (55.8%, a difference of 0.15%), and Ukrainian (55.8%, a difference of 0.17%).
| Demographics | Rating | Rank | 2 or more Vehicles in Household |
| Lumbee | 71.9 /100 | #153 | Good 55.9% |
| Ukrainians | 70.8 /100 | #154 | Good 55.8% |
| Immigrants | Venezuela | 70.7 /100 | #155 | Good 55.8% |
| Immigrants | Lithuania | 70.4 /100 | #156 | Good 55.8% |
| Immigrants | Kuwait | 70.2 /100 | #157 | Good 55.8% |
| Tlingit-Haida | 68.5 /100 | #158 | Good 55.8% |
| Paiute | 68.0 /100 | #159 | Good 55.8% |
| Crow | 67.0 /100 | #160 | Good 55.7% |
| Colville | 61.1 /100 | #161 | Good 55.6% |
| German Russians | 60.9 /100 | #162 | Good 55.6% |
| Immigrants | Zimbabwe | 60.2 /100 | #163 | Good 55.6% |
| Dutch West Indians | 59.8 /100 | #164 | Average 55.6% |
| Immigrants | El Salvador | 59.4 /100 | #165 | Average 55.6% |
| Immigrants | Sri Lanka | 58.3 /100 | #166 | Average 55.5% |
| Kenyans | 58.1 /100 | #167 | Average 55.5% |