Immigrants from India vs Somali 2 or more Vehicles in Household
COMPARE
Immigrants from India
Somali
2 or more Vehicles in Household
2 or more Vehicles in Household Comparison
Immigrants from India
Somalis
59.3%
2 OR MORE VEHICLES IN HOUSEHOLD
99.9/ 100
METRIC RATING
48th/ 347
METRIC RANK
51.1%
2 OR MORE VEHICLES IN HOUSEHOLD
0.0/ 100
METRIC RATING
289th/ 347
METRIC RANK
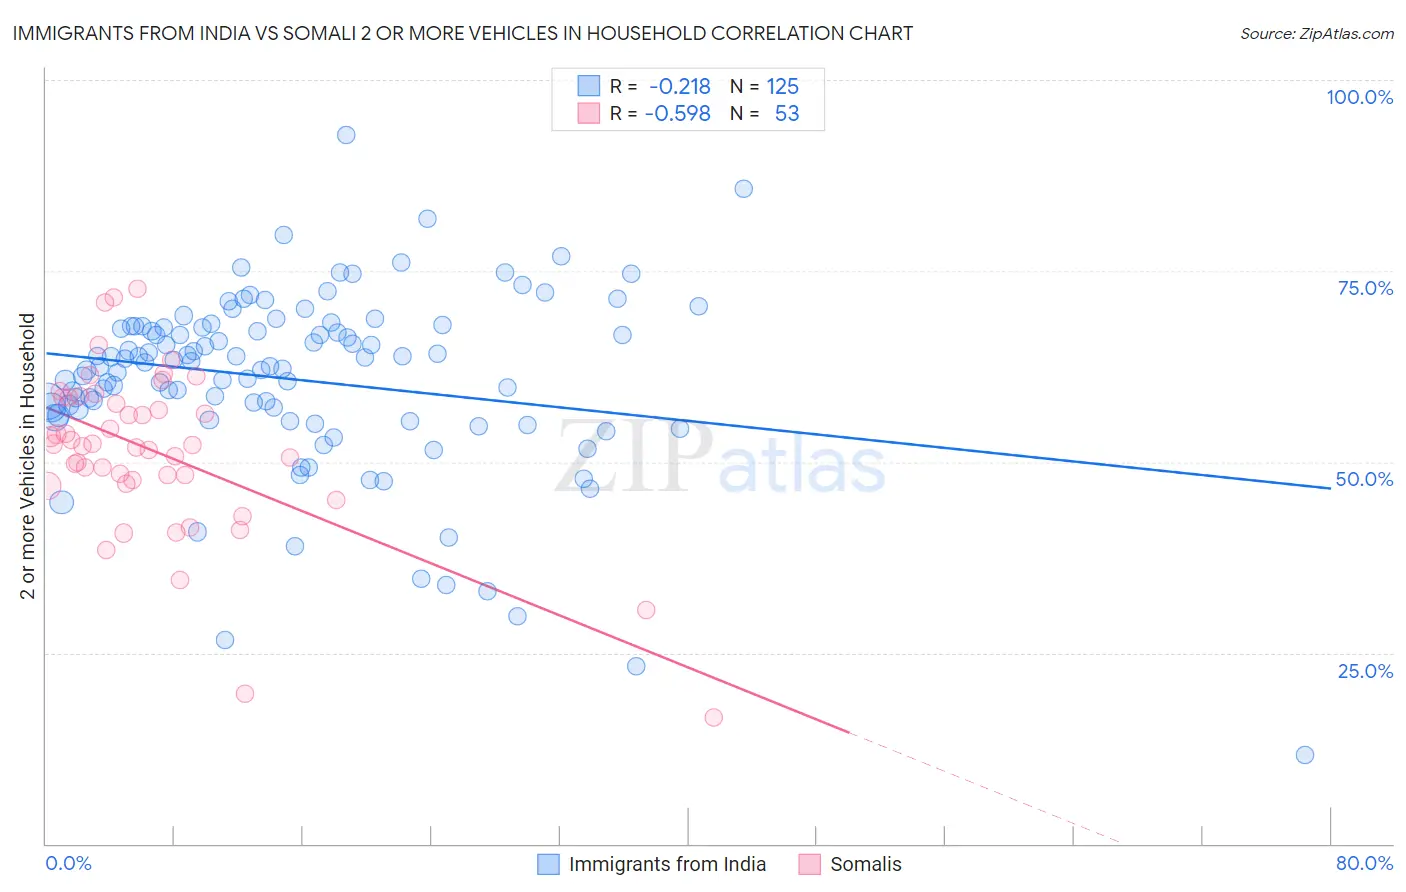
Immigrants from India vs Somali 2 or more Vehicles in Household Correlation Chart
The statistical analysis conducted on geographies consisting of 433,787,530 people shows a weak negative correlation between the proportion of Immigrants from India and percentage of households with 2 or more vehicles available in the United States with a correlation coefficient (R) of -0.218 and weighted average of 59.3%. Similarly, the statistical analysis conducted on geographies consisting of 99,288,956 people shows a substantial negative correlation between the proportion of Somalis and percentage of households with 2 or more vehicles available in the United States with a correlation coefficient (R) of -0.598 and weighted average of 51.1%, a difference of 16.0%.
2 or more Vehicles in Household Correlation Summary
| Measurement | Immigrants from India | Somali |
| Minimum | 11.6% | 16.4% |
| Maximum | 92.9% | 72.6% |
| Range | 81.2% | 56.2% |
| Mean | 60.8% | 51.4% |
| Median | 63.0% | 52.2% |
| Interquartile 25% (IQ1) | 55.9% | 47.3% |
| Interquartile 75% (IQ3) | 67.7% | 58.4% |
| Interquartile Range (IQR) | 11.7% | 11.1% |
| Standard Deviation (Sample) | 12.0% | 10.9% |
| Standard Deviation (Population) | 12.0% | 10.8% |
Similar Demographics by 2 or more Vehicles in Household
Demographics Similar to Immigrants from India by 2 or more Vehicles in Household
In terms of 2 or more vehicles in household, the demographic groups most similar to Immigrants from India are Yaqui (59.3%, a difference of 0.020%), Belgian (59.3%, a difference of 0.040%), Choctaw (59.3%, a difference of 0.040%), Spaniard (59.2%, a difference of 0.18%), and Immigrants from Laos (59.2%, a difference of 0.19%).
| Demographics | Rating | Rank | 2 or more Vehicles in Household |
| Northern Europeans | 100.0 /100 | #41 | Exceptional 59.9% |
| Malaysians | 100.0 /100 | #42 | Exceptional 59.8% |
| Czechoslovakians | 100.0 /100 | #43 | Exceptional 59.8% |
| French | 100.0 /100 | #44 | Exceptional 59.8% |
| Immigrants | Taiwan | 100.0 /100 | #45 | Exceptional 59.7% |
| Immigrants | South Eastern Asia | 100.0 /100 | #46 | Exceptional 59.6% |
| Yaqui | 99.9 /100 | #47 | Exceptional 59.3% |
| Immigrants | India | 99.9 /100 | #48 | Exceptional 59.3% |
| Belgians | 99.9 /100 | #49 | Exceptional 59.3% |
| Choctaw | 99.9 /100 | #50 | Exceptional 59.3% |
| Spaniards | 99.9 /100 | #51 | Exceptional 59.2% |
| Immigrants | Laos | 99.9 /100 | #52 | Exceptional 59.2% |
| Celtics | 99.9 /100 | #53 | Exceptional 59.2% |
| Bhutanese | 99.9 /100 | #54 | Exceptional 59.1% |
| Luxembourgers | 99.9 /100 | #55 | Exceptional 59.1% |
Demographics Similar to Somalis by 2 or more Vehicles in Household
In terms of 2 or more vehicles in household, the demographic groups most similar to Somalis are Immigrants from Panama (51.1%, a difference of 0.060%), Belizean (51.0%, a difference of 0.10%), Okinawan (51.2%, a difference of 0.28%), Immigrants from Serbia (51.3%, a difference of 0.40%), and Immigrants from Liberia (51.3%, a difference of 0.42%).
| Demographics | Rating | Rank | 2 or more Vehicles in Household |
| Bahamians | 0.1 /100 | #282 | Tragic 51.5% |
| Immigrants | China | 0.1 /100 | #283 | Tragic 51.5% |
| Immigrants | Zaire | 0.1 /100 | #284 | Tragic 51.5% |
| Immigrants | Uruguay | 0.1 /100 | #285 | Tragic 51.4% |
| Immigrants | Liberia | 0.1 /100 | #286 | Tragic 51.3% |
| Immigrants | Serbia | 0.1 /100 | #287 | Tragic 51.3% |
| Okinawans | 0.1 /100 | #288 | Tragic 51.2% |
| Somalis | 0.0 /100 | #289 | Tragic 51.1% |
| Immigrants | Panama | 0.0 /100 | #290 | Tragic 51.1% |
| Belizeans | 0.0 /100 | #291 | Tragic 51.0% |
| Immigrants | Ukraine | 0.0 /100 | #292 | Tragic 50.9% |
| Blacks/African Americans | 0.0 /100 | #293 | Tragic 50.9% |
| Bermudans | 0.0 /100 | #294 | Tragic 50.6% |
| Cypriots | 0.0 /100 | #295 | Tragic 50.6% |
| Immigrants | Somalia | 0.0 /100 | #296 | Tragic 50.5% |