Immigrants from India vs Iraqi 2 or more Vehicles in Household
COMPARE
Immigrants from India
Iraqi
2 or more Vehicles in Household
2 or more Vehicles in Household Comparison
Immigrants from India
Iraqis
59.3%
2 OR MORE VEHICLES IN HOUSEHOLD
99.9/ 100
METRIC RATING
48th/ 347
METRIC RANK
57.1%
2 OR MORE VEHICLES IN HOUSEHOLD
95.8/ 100
METRIC RATING
117th/ 347
METRIC RANK
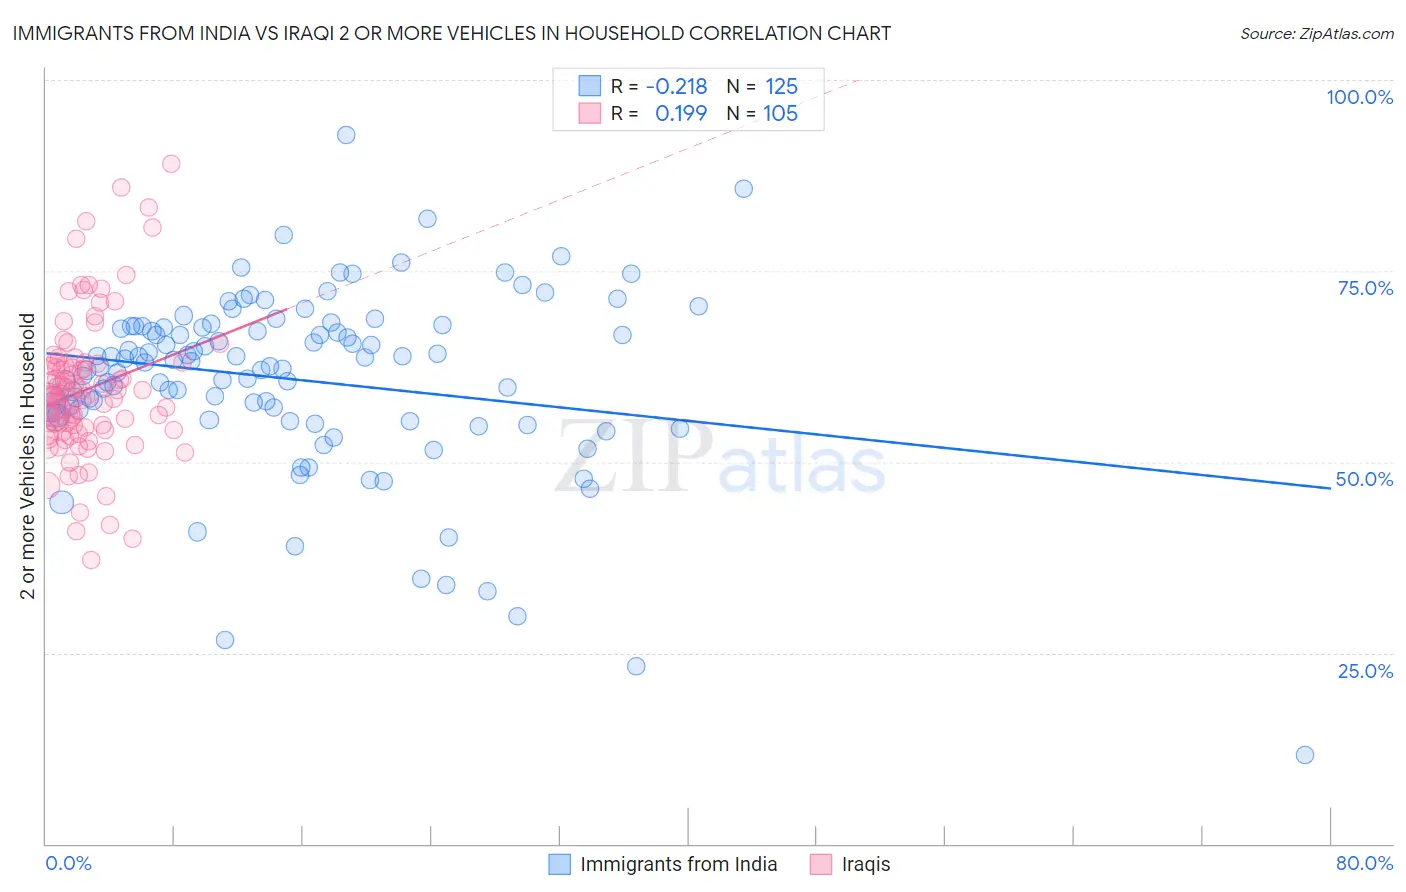
Immigrants from India vs Iraqi 2 or more Vehicles in Household Correlation Chart
The statistical analysis conducted on geographies consisting of 433,787,530 people shows a weak negative correlation between the proportion of Immigrants from India and percentage of households with 2 or more vehicles available in the United States with a correlation coefficient (R) of -0.218 and weighted average of 59.3%. Similarly, the statistical analysis conducted on geographies consisting of 170,650,465 people shows a poor positive correlation between the proportion of Iraqis and percentage of households with 2 or more vehicles available in the United States with a correlation coefficient (R) of 0.199 and weighted average of 57.1%, a difference of 3.9%.
2 or more Vehicles in Household Correlation Summary
| Measurement | Immigrants from India | Iraqi |
| Minimum | 11.6% | 37.2% |
| Maximum | 92.9% | 89.1% |
| Range | 81.2% | 51.9% |
| Mean | 60.8% | 59.5% |
| Median | 63.0% | 58.7% |
| Interquartile 25% (IQ1) | 55.9% | 54.1% |
| Interquartile 75% (IQ3) | 67.7% | 62.9% |
| Interquartile Range (IQR) | 11.7% | 8.7% |
| Standard Deviation (Sample) | 12.0% | 9.3% |
| Standard Deviation (Population) | 12.0% | 9.3% |
Similar Demographics by 2 or more Vehicles in Household
Demographics Similar to Immigrants from India by 2 or more Vehicles in Household
In terms of 2 or more vehicles in household, the demographic groups most similar to Immigrants from India are Yaqui (59.3%, a difference of 0.020%), Belgian (59.3%, a difference of 0.040%), Choctaw (59.3%, a difference of 0.040%), Spaniard (59.2%, a difference of 0.18%), and Immigrants from Laos (59.2%, a difference of 0.19%).
| Demographics | Rating | Rank | 2 or more Vehicles in Household |
| Northern Europeans | 100.0 /100 | #41 | Exceptional 59.9% |
| Malaysians | 100.0 /100 | #42 | Exceptional 59.8% |
| Czechoslovakians | 100.0 /100 | #43 | Exceptional 59.8% |
| French | 100.0 /100 | #44 | Exceptional 59.8% |
| Immigrants | Taiwan | 100.0 /100 | #45 | Exceptional 59.7% |
| Immigrants | South Eastern Asia | 100.0 /100 | #46 | Exceptional 59.6% |
| Yaqui | 99.9 /100 | #47 | Exceptional 59.3% |
| Immigrants | India | 99.9 /100 | #48 | Exceptional 59.3% |
| Belgians | 99.9 /100 | #49 | Exceptional 59.3% |
| Choctaw | 99.9 /100 | #50 | Exceptional 59.3% |
| Spaniards | 99.9 /100 | #51 | Exceptional 59.2% |
| Immigrants | Laos | 99.9 /100 | #52 | Exceptional 59.2% |
| Celtics | 99.9 /100 | #53 | Exceptional 59.2% |
| Bhutanese | 99.9 /100 | #54 | Exceptional 59.1% |
| Luxembourgers | 99.9 /100 | #55 | Exceptional 59.1% |
Demographics Similar to Iraqis by 2 or more Vehicles in Household
In terms of 2 or more vehicles in household, the demographic groups most similar to Iraqis are Asian (57.0%, a difference of 0.16%), Immigrants from Jordan (57.2%, a difference of 0.19%), Native/Alaskan (57.0%, a difference of 0.19%), Chippewa (57.2%, a difference of 0.20%), and Costa Rican (56.9%, a difference of 0.24%).
| Demographics | Rating | Rank | 2 or more Vehicles in Household |
| Japanese | 98.0 /100 | #110 | Exceptional 57.5% |
| Greeks | 98.0 /100 | #111 | Exceptional 57.5% |
| Pueblo | 98.0 /100 | #112 | Exceptional 57.5% |
| Zimbabweans | 96.9 /100 | #113 | Exceptional 57.2% |
| Immigrants | Lebanon | 96.8 /100 | #114 | Exceptional 57.2% |
| Chippewa | 96.6 /100 | #115 | Exceptional 57.2% |
| Immigrants | Jordan | 96.6 /100 | #116 | Exceptional 57.2% |
| Iraqis | 95.8 /100 | #117 | Exceptional 57.1% |
| Asians | 95.1 /100 | #118 | Exceptional 57.0% |
| Natives/Alaskans | 95.0 /100 | #119 | Exceptional 57.0% |
| Costa Ricans | 94.7 /100 | #120 | Exceptional 56.9% |
| Sioux | 93.8 /100 | #121 | Exceptional 56.8% |
| Immigrants | South Africa | 92.5 /100 | #122 | Exceptional 56.7% |
| Australians | 91.8 /100 | #123 | Exceptional 56.7% |
| New Zealanders | 91.8 /100 | #124 | Exceptional 56.7% |