Argentinean vs Immigrants from Iran 2 or more Vehicles in Household
COMPARE
Argentinean
Immigrants from Iran
2 or more Vehicles in Household
2 or more Vehicles in Household Comparison
Argentineans
Immigrants from Iran
54.5%
2 OR MORE VEHICLES IN HOUSEHOLD
17.5/ 100
METRIC RATING
197th/ 347
METRIC RANK
57.9%
2 OR MORE VEHICLES IN HOUSEHOLD
99.1/ 100
METRIC RATING
88th/ 347
METRIC RANK
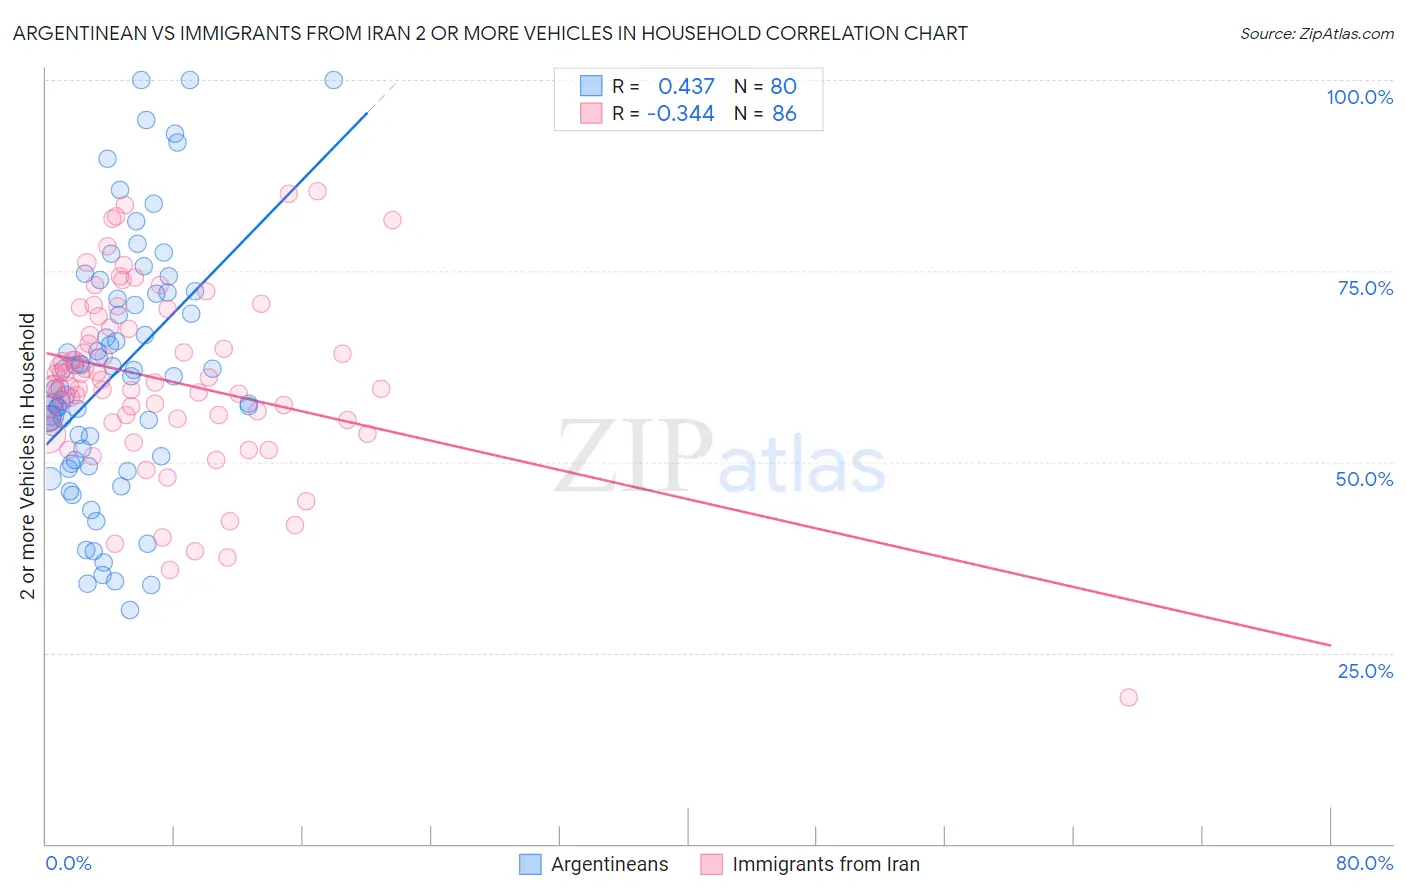
Argentinean vs Immigrants from Iran 2 or more Vehicles in Household Correlation Chart
The statistical analysis conducted on geographies consisting of 297,010,599 people shows a moderate positive correlation between the proportion of Argentineans and percentage of households with 2 or more vehicles available in the United States with a correlation coefficient (R) of 0.437 and weighted average of 54.5%. Similarly, the statistical analysis conducted on geographies consisting of 279,850,243 people shows a mild negative correlation between the proportion of Immigrants from Iran and percentage of households with 2 or more vehicles available in the United States with a correlation coefficient (R) of -0.344 and weighted average of 57.9%, a difference of 6.3%.
2 or more Vehicles in Household Correlation Summary
| Measurement | Argentinean | Immigrants from Iran |
| Minimum | 30.7% | 19.2% |
| Maximum | 100.0% | 85.4% |
| Range | 69.3% | 66.2% |
| Mean | 61.6% | 60.8% |
| Median | 60.4% | 60.2% |
| Interquartile 25% (IQ1) | 50.4% | 55.5% |
| Interquartile 75% (IQ3) | 71.7% | 67.5% |
| Interquartile Range (IQR) | 21.3% | 12.0% |
| Standard Deviation (Sample) | 16.3% | 11.9% |
| Standard Deviation (Population) | 16.2% | 11.8% |
Similar Demographics by 2 or more Vehicles in Household
Demographics Similar to Argentineans by 2 or more Vehicles in Household
In terms of 2 or more vehicles in household, the demographic groups most similar to Argentineans are Carpatho Rusyn (54.4%, a difference of 0.090%), Immigrants from Poland (54.6%, a difference of 0.12%), Immigrants from Norway (54.4%, a difference of 0.12%), Houma (54.4%, a difference of 0.12%), and Immigrants from Italy (54.4%, a difference of 0.15%).
| Demographics | Rating | Rank | 2 or more Vehicles in Household |
| Russians | 26.3 /100 | #190 | Fair 54.8% |
| Immigrants | Immigrants | 25.0 /100 | #191 | Fair 54.7% |
| Immigrants | Romania | 23.8 /100 | #192 | Fair 54.7% |
| Immigrants | Japan | 23.4 /100 | #193 | Fair 54.7% |
| Central Americans | 23.0 /100 | #194 | Fair 54.7% |
| Iroquois | 22.6 /100 | #195 | Fair 54.7% |
| Immigrants | Poland | 19.3 /100 | #196 | Poor 54.6% |
| Argentineans | 17.5 /100 | #197 | Poor 54.5% |
| Carpatho Rusyns | 16.2 /100 | #198 | Poor 54.4% |
| Immigrants | Norway | 15.9 /100 | #199 | Poor 54.4% |
| Houma | 15.8 /100 | #200 | Poor 54.4% |
| Immigrants | Italy | 15.5 /100 | #201 | Poor 54.4% |
| Immigrants | North Macedonia | 14.9 /100 | #202 | Poor 54.4% |
| Immigrants | Peru | 14.3 /100 | #203 | Poor 54.4% |
| Immigrants | Belgium | 13.7 /100 | #204 | Poor 54.3% |
Demographics Similar to Immigrants from Iran by 2 or more Vehicles in Household
In terms of 2 or more vehicles in household, the demographic groups most similar to Immigrants from Iran are Thai (57.9%, a difference of 0.010%), Potawatomi (58.0%, a difference of 0.050%), Immigrants from Germany (57.9%, a difference of 0.070%), Hispanic or Latino (57.9%, a difference of 0.070%), and Slovak (58.0%, a difference of 0.080%).
| Demographics | Rating | Rank | 2 or more Vehicles in Household |
| Immigrants | Iraq | 99.3 /100 | #81 | Exceptional 58.1% |
| Iranians | 99.3 /100 | #82 | Exceptional 58.1% |
| Icelanders | 99.2 /100 | #83 | Exceptional 58.0% |
| Maltese | 99.2 /100 | #84 | Exceptional 58.0% |
| Slovaks | 99.2 /100 | #85 | Exceptional 58.0% |
| Potawatomi | 99.1 /100 | #86 | Exceptional 58.0% |
| Thais | 99.1 /100 | #87 | Exceptional 57.9% |
| Immigrants | Iran | 99.1 /100 | #88 | Exceptional 57.9% |
| Immigrants | Germany | 99.0 /100 | #89 | Exceptional 57.9% |
| Hispanics or Latinos | 99.0 /100 | #90 | Exceptional 57.9% |
| Pakistanis | 99.0 /100 | #91 | Exceptional 57.9% |
| Shoshone | 99.0 /100 | #92 | Exceptional 57.9% |
| Ottawa | 99.0 /100 | #93 | Exceptional 57.9% |
| Filipinos | 98.9 /100 | #94 | Exceptional 57.8% |
| Hmong | 98.9 /100 | #95 | Exceptional 57.8% |