Argentinean vs Tohono O'odham 2 or more Vehicles in Household
COMPARE
Argentinean
Tohono O'odham
2 or more Vehicles in Household
2 or more Vehicles in Household Comparison
Argentineans
Tohono O'odham
54.5%
2 OR MORE VEHICLES IN HOUSEHOLD
17.5/ 100
METRIC RATING
197th/ 347
METRIC RANK
50.0%
2 OR MORE VEHICLES IN HOUSEHOLD
0.0/ 100
METRIC RATING
303rd/ 347
METRIC RANK
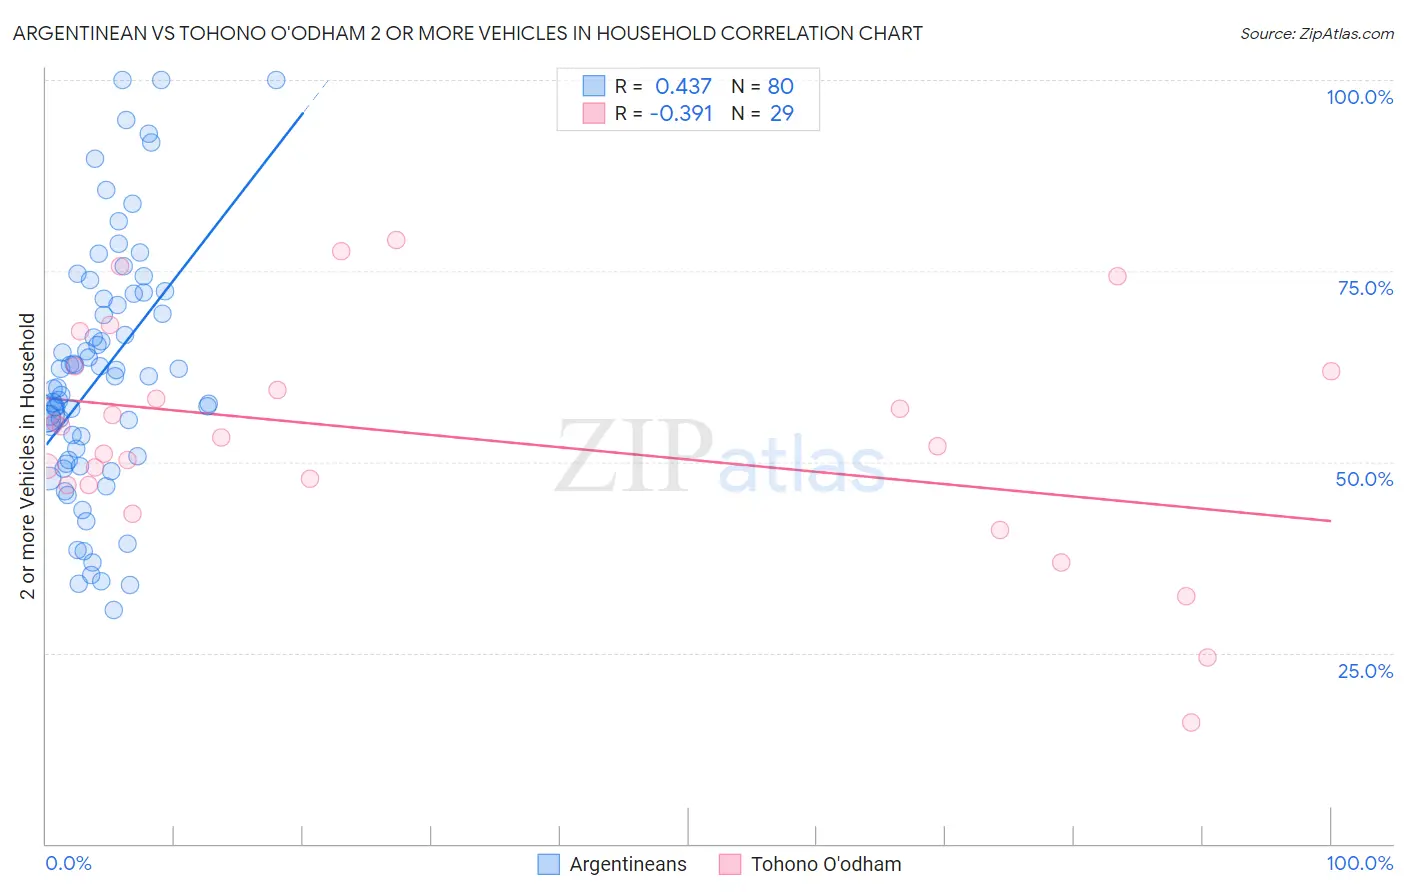
Argentinean vs Tohono O'odham 2 or more Vehicles in Household Correlation Chart
The statistical analysis conducted on geographies consisting of 297,010,599 people shows a moderate positive correlation between the proportion of Argentineans and percentage of households with 2 or more vehicles available in the United States with a correlation coefficient (R) of 0.437 and weighted average of 54.5%. Similarly, the statistical analysis conducted on geographies consisting of 58,718,439 people shows a mild negative correlation between the proportion of Tohono O'odham and percentage of households with 2 or more vehicles available in the United States with a correlation coefficient (R) of -0.391 and weighted average of 50.0%, a difference of 9.0%.
2 or more Vehicles in Household Correlation Summary
| Measurement | Argentinean | Tohono O'odham |
| Minimum | 30.7% | 15.9% |
| Maximum | 100.0% | 79.0% |
| Range | 69.3% | 63.1% |
| Mean | 61.6% | 53.3% |
| Median | 60.4% | 53.2% |
| Interquartile 25% (IQ1) | 50.4% | 47.0% |
| Interquartile 75% (IQ3) | 71.7% | 62.2% |
| Interquartile Range (IQR) | 21.3% | 15.3% |
| Standard Deviation (Sample) | 16.3% | 14.9% |
| Standard Deviation (Population) | 16.2% | 14.6% |
Similar Demographics by 2 or more Vehicles in Household
Demographics Similar to Argentineans by 2 or more Vehicles in Household
In terms of 2 or more vehicles in household, the demographic groups most similar to Argentineans are Carpatho Rusyn (54.4%, a difference of 0.090%), Immigrants from Poland (54.6%, a difference of 0.12%), Immigrants from Norway (54.4%, a difference of 0.12%), Houma (54.4%, a difference of 0.12%), and Immigrants from Italy (54.4%, a difference of 0.15%).
| Demographics | Rating | Rank | 2 or more Vehicles in Household |
| Russians | 26.3 /100 | #190 | Fair 54.8% |
| Immigrants | Immigrants | 25.0 /100 | #191 | Fair 54.7% |
| Immigrants | Romania | 23.8 /100 | #192 | Fair 54.7% |
| Immigrants | Japan | 23.4 /100 | #193 | Fair 54.7% |
| Central Americans | 23.0 /100 | #194 | Fair 54.7% |
| Iroquois | 22.6 /100 | #195 | Fair 54.7% |
| Immigrants | Poland | 19.3 /100 | #196 | Poor 54.6% |
| Argentineans | 17.5 /100 | #197 | Poor 54.5% |
| Carpatho Rusyns | 16.2 /100 | #198 | Poor 54.4% |
| Immigrants | Norway | 15.9 /100 | #199 | Poor 54.4% |
| Houma | 15.8 /100 | #200 | Poor 54.4% |
| Immigrants | Italy | 15.5 /100 | #201 | Poor 54.4% |
| Immigrants | North Macedonia | 14.9 /100 | #202 | Poor 54.4% |
| Immigrants | Peru | 14.3 /100 | #203 | Poor 54.4% |
| Immigrants | Belgium | 13.7 /100 | #204 | Poor 54.3% |
Demographics Similar to Tohono O'odham by 2 or more Vehicles in Household
In terms of 2 or more vehicles in household, the demographic groups most similar to Tohono O'odham are Immigrants from Belize (49.9%, a difference of 0.20%), Immigrants from South America (50.2%, a difference of 0.37%), Immigrants from Greece (50.2%, a difference of 0.43%), Immigrants from Russia (50.3%, a difference of 0.62%), and Immigrants from Morocco (50.3%, a difference of 0.65%).
| Demographics | Rating | Rank | 2 or more Vehicles in Household |
| Immigrants | Somalia | 0.0 /100 | #296 | Tragic 50.5% |
| Immigrants | Spain | 0.0 /100 | #297 | Tragic 50.4% |
| Paraguayans | 0.0 /100 | #298 | Tragic 50.3% |
| Immigrants | Morocco | 0.0 /100 | #299 | Tragic 50.3% |
| Immigrants | Russia | 0.0 /100 | #300 | Tragic 50.3% |
| Immigrants | Greece | 0.0 /100 | #301 | Tragic 50.2% |
| Immigrants | South America | 0.0 /100 | #302 | Tragic 50.2% |
| Tohono O'odham | 0.0 /100 | #303 | Tragic 50.0% |
| Immigrants | Belize | 0.0 /100 | #304 | Tragic 49.9% |
| Immigrants | Western Africa | 0.0 /100 | #305 | Tragic 49.4% |
| Immigrants | Israel | 0.0 /100 | #306 | Tragic 49.2% |
| Hopi | 0.0 /100 | #307 | Tragic 49.0% |
| Albanians | 0.0 /100 | #308 | Tragic 49.0% |
| Moroccans | 0.0 /100 | #309 | Tragic 48.8% |
| Ghanaians | 0.0 /100 | #310 | Tragic 48.0% |