Argentinean Male Disability
COMPARE
Argentinean
Select to Compare
Male Disability
Argentinean Male Disability
10.1%
DISABILITY | MALES
99.9/ 100
METRIC RATING
32nd/ 347
METRIC RANK
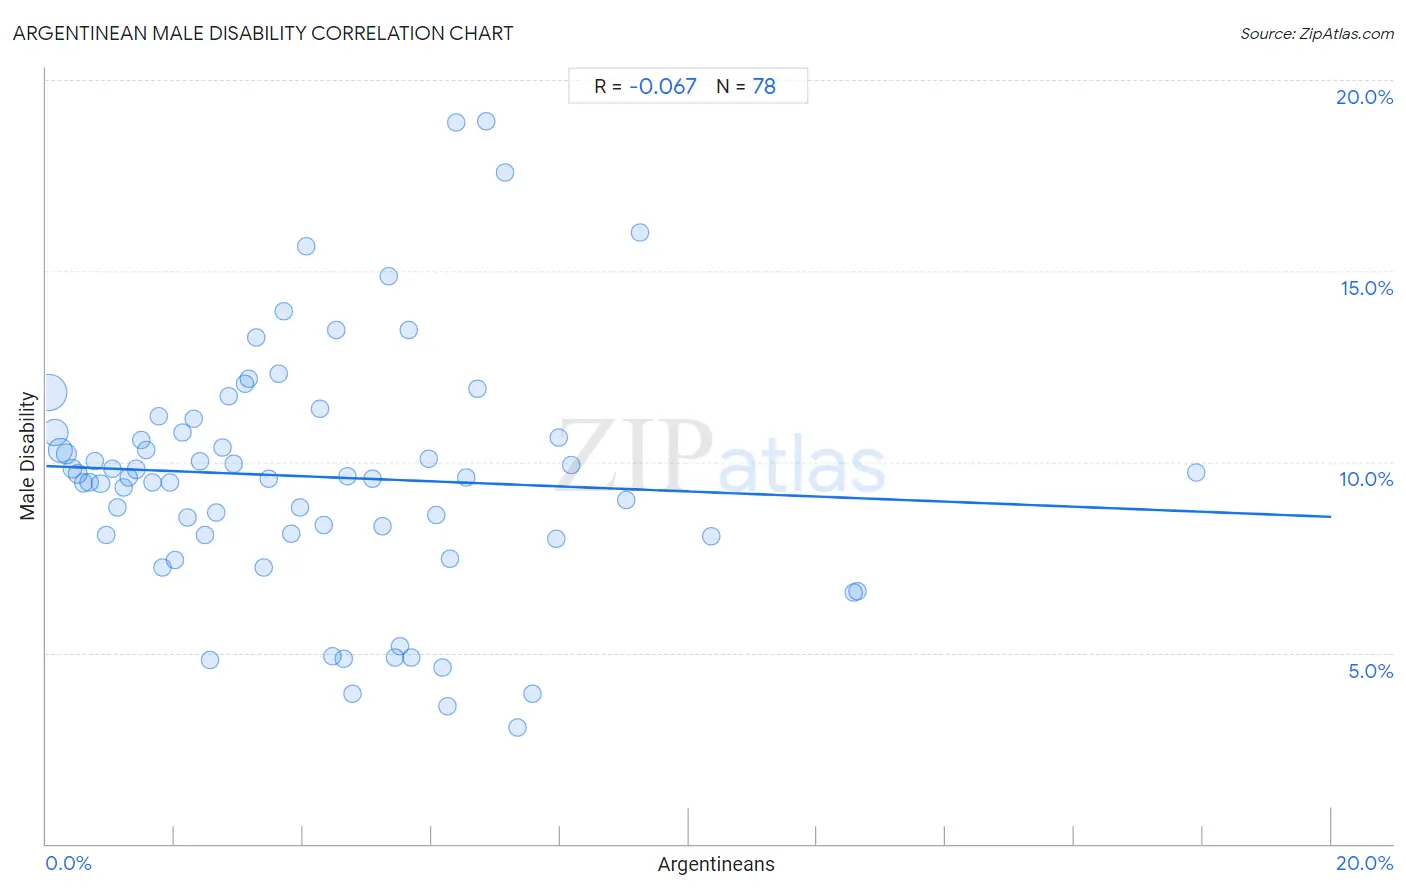
Argentinean Male Disability Correlation Chart
The statistical analysis conducted on geographies consisting of 297,137,654 people shows a slight negative correlation between the proportion of Argentineans and percentage of males with a disability in the United States with a correlation coefficient (R) of -0.067 and weighted average of 10.1%. On average, for every 1% (one percent) increase in Argentineans within a typical geography, there is a decrease of 0.066% in percentage of males with a disability.
It is essential to understand that the correlation between the percentage of Argentineans and percentage of males with a disability does not imply a direct cause-and-effect relationship. It remains uncertain whether the presence of Argentineans influences an upward or downward trend in the level of percentage of males with a disability within an area, or if Argentineans simply ended up residing in those areas with higher or lower levels of percentage of males with a disability due to other factors.
Demographics Similar to Argentineans by Male Disability
In terms of male disability, the demographic groups most similar to Argentineans are Soviet Union (10.1%, a difference of 0.15%), Immigrants from Egypt (10.1%, a difference of 0.22%), Venezuelan (10.1%, a difference of 0.25%), Vietnamese (10.1%, a difference of 0.41%), and Egyptian (10.1%, a difference of 0.43%).
| Demographics | Rating | Rank | Male Disability |
| Immigrants from Malaysia | 99.9 /100 | #25 | Exceptional 10.0% |
| Paraguayans | 99.9 /100 | #26 | Exceptional 10.1% |
| Egyptians | 99.9 /100 | #27 | Exceptional 10.1% |
| Vietnamese | 99.9 /100 | #28 | Exceptional 10.1% |
| Venezuelans | 99.9 /100 | #29 | Exceptional 10.1% |
| Immigrants from Egypt | 99.9 /100 | #30 | Exceptional 10.1% |
| Soviet Union | 99.9 /100 | #31 | Exceptional 10.1% |
| Argentineans | 99.9 /100 | #32 | Exceptional 10.1% |
| Immigrants from Ethiopia | 99.9 /100 | #33 | Exceptional 10.2% |
| Immigrants from Turkey | 99.9 /100 | #34 | Exceptional 10.2% |
| Immigrants from Argentina | 99.9 /100 | #35 | Exceptional 10.2% |
| Ethiopians | 99.8 /100 | #36 | Exceptional 10.2% |
| Immigrants from Indonesia | 99.8 /100 | #37 | Exceptional 10.2% |
| Immigrants from Kuwait | 99.8 /100 | #38 | Exceptional 10.2% |
| Afghans | 99.8 /100 | #39 | Exceptional 10.2% |
Argentinean Male Disability Correlation Summary
| Measurement | Argentinean Data | Male Disability Data |
| Minimum | 0.045% | 3.0% |
| Maximum | 17.9% | 18.9% |
| Range | 17.9% | 15.9% |
| Mean | 4.2% | 9.6% |
| Median | 3.7% | 9.6% |
| Interquartile 25% (IQ1) | 1.8% | 8.1% |
| Interquartile 75% (IQ3) | 6.1% | 10.8% |
| Interquartile Range (IQR) | 4.3% | 2.7% |
| Standard Deviation (Sample) | 3.3% | 3.2% |
| Standard Deviation (Population) | 3.2% | 3.2% |
Correlation Details
| Argentinean Percentile | Sample Size | Male Disability |
[ 0.0% - 0.5% ] 0.045% | 139,477,420 | 11.8% |
[ 0.0% - 0.5% ] 0.13% | 65,114,107 | 10.8% |
[ 0.0% - 0.5% ] 0.22% | 40,735,722 | 10.3% |
[ 0.0% - 0.5% ] 0.31% | 16,519,045 | 10.2% |
[ 0.0% - 0.5% ] 0.40% | 10,020,590 | 9.8% |
[ 0.0% - 0.5% ] 0.50% | 6,294,883 | 9.7% |
[ 0.5% - 1.0% ] 0.58% | 4,138,915 | 9.4% |
[ 0.5% - 1.0% ] 0.67% | 3,038,781 | 9.5% |
[ 0.5% - 1.0% ] 0.75% | 2,584,759 | 10.0% |
[ 0.5% - 1.0% ] 0.85% | 1,341,177 | 9.4% |
[ 0.5% - 1.0% ] 0.93% | 1,061,466 | 8.1% |
[ 1.0% - 1.5% ] 1.03% | 972,410 | 9.8% |
[ 1.0% - 1.5% ] 1.11% | 677,441 | 8.8% |
[ 1.0% - 1.5% ] 1.20% | 995,284 | 9.3% |
[ 1.0% - 1.5% ] 1.29% | 555,584 | 9.6% |
[ 1.0% - 1.5% ] 1.40% | 877,928 | 9.8% |
[ 1.0% - 1.5% ] 1.48% | 267,037 | 10.6% |
[ 1.5% - 2.0% ] 1.56% | 212,667 | 10.3% |
[ 1.5% - 2.0% ] 1.64% | 180,007 | 9.5% |
[ 1.5% - 2.0% ] 1.76% | 241,358 | 11.2% |
[ 1.5% - 2.0% ] 1.81% | 154,011 | 7.2% |
[ 1.5% - 2.0% ] 1.93% | 135,496 | 9.5% |
[ 1.5% - 2.0% ] 2.00% | 201,906 | 7.4% |
[ 2.0% - 2.5% ] 2.12% | 92,731 | 10.8% |
[ 2.0% - 2.5% ] 2.19% | 99,958 | 8.5% |
[ 2.0% - 2.5% ] 2.29% | 61,444 | 11.1% |
[ 2.0% - 2.5% ] 2.39% | 33,303 | 10.0% |
[ 2.0% - 2.5% ] 2.46% | 96,611 | 8.1% |
[ 2.5% - 3.0% ] 2.55% | 30,528 | 4.8% |
[ 2.5% - 3.0% ] 2.65% | 76,703 | 8.7% |
[ 2.5% - 3.0% ] 2.75% | 59,884 | 10.4% |
[ 2.5% - 3.0% ] 2.84% | 47,970 | 11.7% |
[ 2.5% - 3.0% ] 2.92% | 16,342 | 9.9% |
[ 3.0% - 3.5% ] 3.09% | 93,687 | 12.0% |
[ 3.0% - 3.5% ] 3.16% | 23,405 | 12.2% |
[ 3.0% - 3.5% ] 3.26% | 2,207 | 13.3% |
[ 3.0% - 3.5% ] 3.38% | 74,653 | 7.2% |
[ 3.0% - 3.5% ] 3.46% | 73,622 | 9.6% |
[ 3.5% - 4.0% ] 3.62% | 57,196 | 12.3% |
[ 3.5% - 4.0% ] 3.70% | 10,989 | 13.9% |
[ 3.5% - 4.0% ] 3.80% | 6,651 | 8.1% |
[ 3.5% - 4.0% ] 3.95% | 12,579 | 8.8% |
[ 4.0% - 4.5% ] 4.04% | 1,360 | 15.7% |
[ 4.0% - 4.5% ] 4.26% | 24,163 | 11.4% |
[ 4.0% - 4.5% ] 4.32% | 19,563 | 8.4% |
[ 4.0% - 4.5% ] 4.46% | 13,255 | 4.9% |
[ 4.5% - 5.0% ] 4.51% | 6,225 | 13.5% |
[ 4.5% - 5.0% ] 4.63% | 23,734 | 4.8% |
[ 4.5% - 5.0% ] 4.68% | 33,282 | 9.6% |
[ 4.5% - 5.0% ] 4.76% | 1,994 | 3.9% |
[ 5.0% - 5.5% ] 5.07% | 2,683 | 9.6% |
[ 5.0% - 5.5% ] 5.24% | 98,850 | 8.3% |
[ 5.0% - 5.5% ] 5.33% | 7,792 | 14.9% |
[ 5.0% - 5.5% ] 5.43% | 11,638 | 4.9% |
[ 5.5% - 6.0% ] 5.51% | 7,388 | 5.2% |
[ 5.5% - 6.0% ] 5.63% | 1,917 | 13.4% |
[ 5.5% - 6.0% ] 5.68% | 88 | 4.9% |
[ 5.5% - 6.0% ] 5.95% | 605 | 10.1% |
[ 6.0% - 6.5% ] 6.06% | 1,237 | 8.6% |
[ 6.0% - 6.5% ] 6.18% | 6,590 | 4.6% |
[ 6.0% - 6.5% ] 6.24% | 593 | 3.6% |
[ 6.0% - 6.5% ] 6.29% | 19,785 | 7.5% |
[ 6.0% - 6.5% ] 6.37% | 1,381 | 18.9% |
[ 6.5% - 7.0% ] 6.54% | 35,967 | 9.6% |
[ 6.5% - 7.0% ] 6.71% | 1,013 | 11.9% |
[ 6.5% - 7.0% ] 6.85% | 3,589 | 18.9% |
[ 7.0% - 7.5% ] 7.15% | 5,290 | 17.6% |
[ 7.0% - 7.5% ] 7.33% | 887 | 3.0% |
[ 7.5% - 8.0% ] 7.56% | 238 | 3.9% |
[ 7.5% - 8.0% ] 7.94% | 3,174 | 8.0% |
[ 7.5% - 8.0% ] 7.98% | 689 | 10.6% |
[ 8.0% - 8.5% ] 8.17% | 1,041 | 9.9% |
[ 9.0% - 9.5% ] 9.02% | 2,461 | 9.0% |
[ 9.0% - 9.5% ] 9.24% | 563 | 16.0% |
[ 10.0% - 10.5% ] 10.36% | 560 | 8.0% |
[ 12.5% - 13.0% ] 12.57% | 14,639 | 6.6% |
[ 12.5% - 13.0% ] 12.63% | 14,572 | 6.6% |
[ 17.5% - 18.0% ] 17.90% | 391 | 9.7% |