Argentinean vs Bulgarian 2 or more Vehicles in Household
COMPARE
Argentinean
Bulgarian
2 or more Vehicles in Household
2 or more Vehicles in Household Comparison
Argentineans
Bulgarians
54.5%
2 OR MORE VEHICLES IN HOUSEHOLD
17.5/ 100
METRIC RATING
197th/ 347
METRIC RANK
56.5%
2 OR MORE VEHICLES IN HOUSEHOLD
89.7/ 100
METRIC RATING
131st/ 347
METRIC RANK
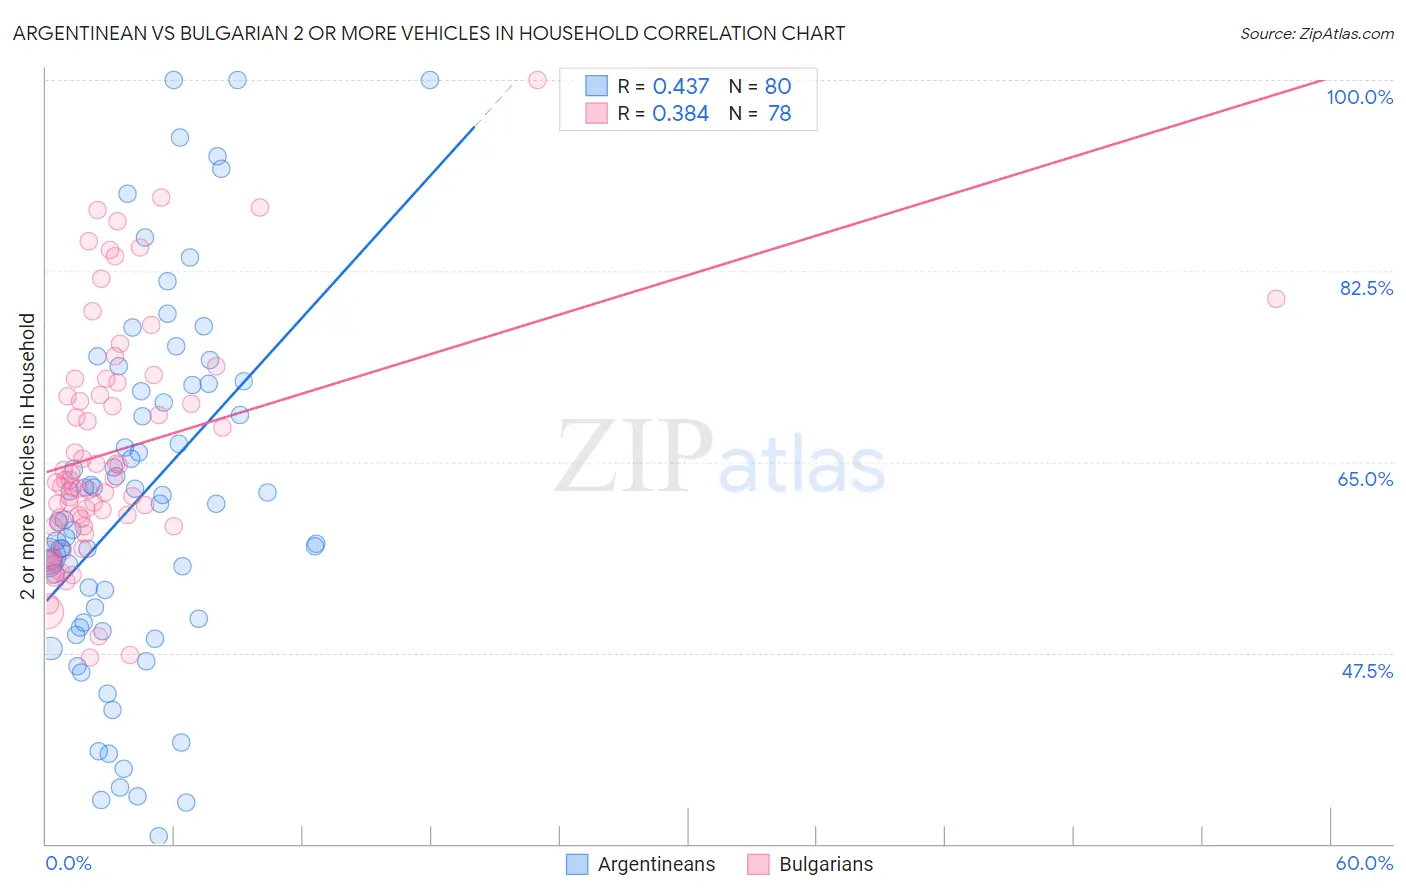
Argentinean vs Bulgarian 2 or more Vehicles in Household Correlation Chart
The statistical analysis conducted on geographies consisting of 297,010,599 people shows a moderate positive correlation between the proportion of Argentineans and percentage of households with 2 or more vehicles available in the United States with a correlation coefficient (R) of 0.437 and weighted average of 54.5%. Similarly, the statistical analysis conducted on geographies consisting of 205,573,622 people shows a mild positive correlation between the proportion of Bulgarians and percentage of households with 2 or more vehicles available in the United States with a correlation coefficient (R) of 0.384 and weighted average of 56.5%, a difference of 3.8%.
2 or more Vehicles in Household Correlation Summary
| Measurement | Argentinean | Bulgarian |
| Minimum | 30.7% | 47.1% |
| Maximum | 100.0% | 100.0% |
| Range | 69.3% | 52.9% |
| Mean | 61.6% | 66.1% |
| Median | 60.4% | 63.2% |
| Interquartile 25% (IQ1) | 50.4% | 59.1% |
| Interquartile 75% (IQ3) | 71.7% | 72.2% |
| Interquartile Range (IQR) | 21.3% | 13.1% |
| Standard Deviation (Sample) | 16.3% | 10.9% |
| Standard Deviation (Population) | 16.2% | 10.8% |
Similar Demographics by 2 or more Vehicles in Household
Demographics Similar to Argentineans by 2 or more Vehicles in Household
In terms of 2 or more vehicles in household, the demographic groups most similar to Argentineans are Carpatho Rusyn (54.4%, a difference of 0.090%), Immigrants from Poland (54.6%, a difference of 0.12%), Immigrants from Norway (54.4%, a difference of 0.12%), Houma (54.4%, a difference of 0.12%), and Immigrants from Italy (54.4%, a difference of 0.15%).
| Demographics | Rating | Rank | 2 or more Vehicles in Household |
| Russians | 26.3 /100 | #190 | Fair 54.8% |
| Immigrants | Immigrants | 25.0 /100 | #191 | Fair 54.7% |
| Immigrants | Romania | 23.8 /100 | #192 | Fair 54.7% |
| Immigrants | Japan | 23.4 /100 | #193 | Fair 54.7% |
| Central Americans | 23.0 /100 | #194 | Fair 54.7% |
| Iroquois | 22.6 /100 | #195 | Fair 54.7% |
| Immigrants | Poland | 19.3 /100 | #196 | Poor 54.6% |
| Argentineans | 17.5 /100 | #197 | Poor 54.5% |
| Carpatho Rusyns | 16.2 /100 | #198 | Poor 54.4% |
| Immigrants | Norway | 15.9 /100 | #199 | Poor 54.4% |
| Houma | 15.8 /100 | #200 | Poor 54.4% |
| Immigrants | Italy | 15.5 /100 | #201 | Poor 54.4% |
| Immigrants | North Macedonia | 14.9 /100 | #202 | Poor 54.4% |
| Immigrants | Peru | 14.3 /100 | #203 | Poor 54.4% |
| Immigrants | Belgium | 13.7 /100 | #204 | Poor 54.3% |
Demographics Similar to Bulgarians by 2 or more Vehicles in Household
In terms of 2 or more vehicles in household, the demographic groups most similar to Bulgarians are Yugoslavian (56.6%, a difference of 0.030%), Hungarian (56.5%, a difference of 0.060%), Ute (56.6%, a difference of 0.070%), Immigrants from South Central Asia (56.6%, a difference of 0.080%), and Immigrants from Thailand (56.6%, a difference of 0.10%).
| Demographics | Rating | Rank | 2 or more Vehicles in Household |
| New Zealanders | 91.8 /100 | #124 | Exceptional 56.7% |
| Tsimshian | 91.6 /100 | #125 | Exceptional 56.7% |
| Estonians | 90.9 /100 | #126 | Exceptional 56.6% |
| Immigrants | Thailand | 90.7 /100 | #127 | Exceptional 56.6% |
| Immigrants | South Central Asia | 90.5 /100 | #128 | Exceptional 56.6% |
| Ute | 90.4 /100 | #129 | Exceptional 56.6% |
| Yugoslavians | 90.0 /100 | #130 | Exceptional 56.6% |
| Bulgarians | 89.7 /100 | #131 | Excellent 56.5% |
| Hungarians | 89.1 /100 | #132 | Excellent 56.5% |
| Comanche | 88.4 /100 | #133 | Excellent 56.5% |
| Immigrants | Azores | 86.6 /100 | #134 | Excellent 56.4% |
| Blackfeet | 86.5 /100 | #135 | Excellent 56.4% |
| Immigrants | Asia | 86.0 /100 | #136 | Excellent 56.3% |
| Cubans | 84.8 /100 | #137 | Excellent 56.3% |
| Salvadorans | 84.7 /100 | #138 | Excellent 56.3% |